Introduction to Quarto
Leykun (MSc)1 & Yebelay (MSc)2
1NDMC, EPHI and 2DMU & C4ED
April 28 - May 1, 2026
![]()
What is Quarto?
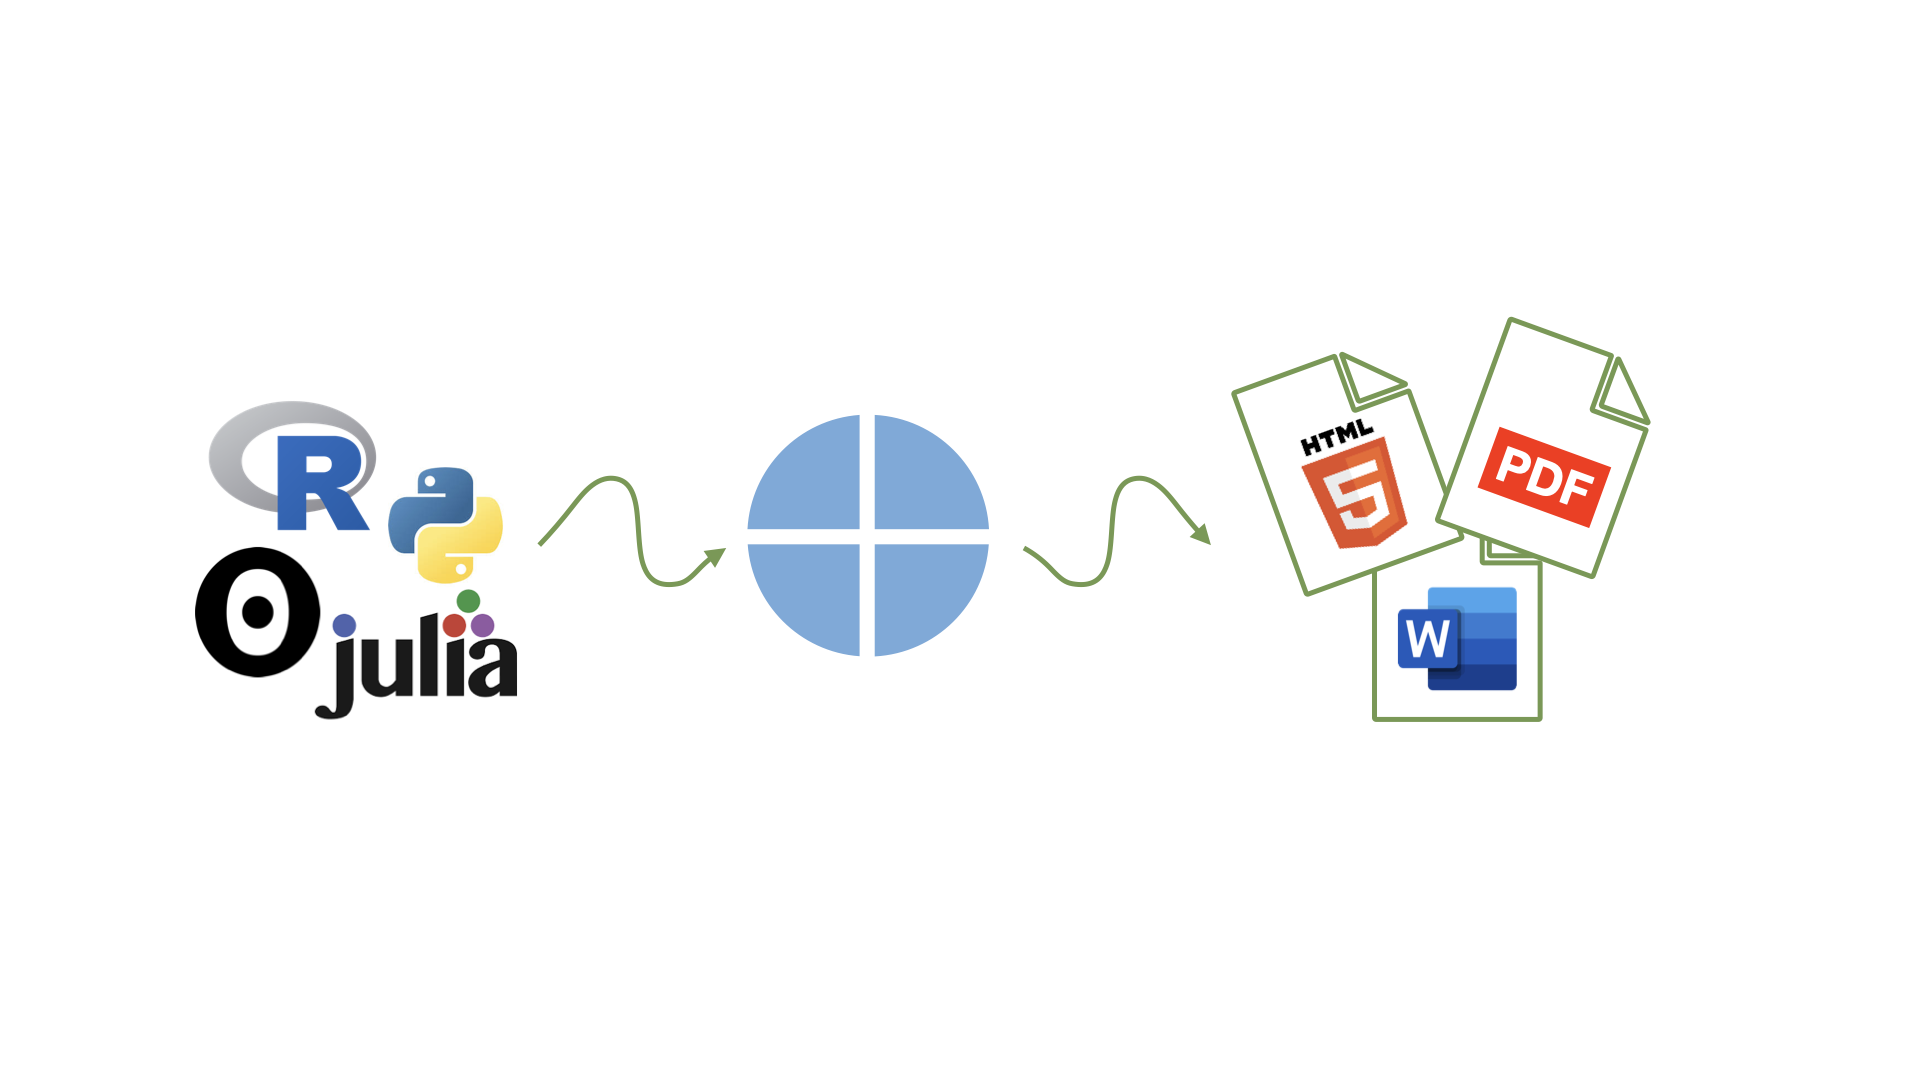
- Quarto is an open-source scientific and technical publishing system built on Pandoc
- Successor to R Markdown with expanded capabilities
- Supports multiple languages:
R,Python,Julia, andObservable - Produces diverse outputs: reports, presentations, websites, books, and more
- Publishes to multiple formats:
HTML,PDF, andWord
Why Quarto?
-
Multilingual — works across
R,Python,Julia, andObservableindependently - Built-in by default — comes with themes, templates, and cross-referencing included; no plugins or configuration needed to get started
-
Single-source publishing — generate
Word,PDF, andHTMLfrom one source file - Consistent syntax — uniform syntax for core features across all formats
- Extensible — a rich extension system for custom functionality
- Accessible by default — outputs meet accessibility guidelines
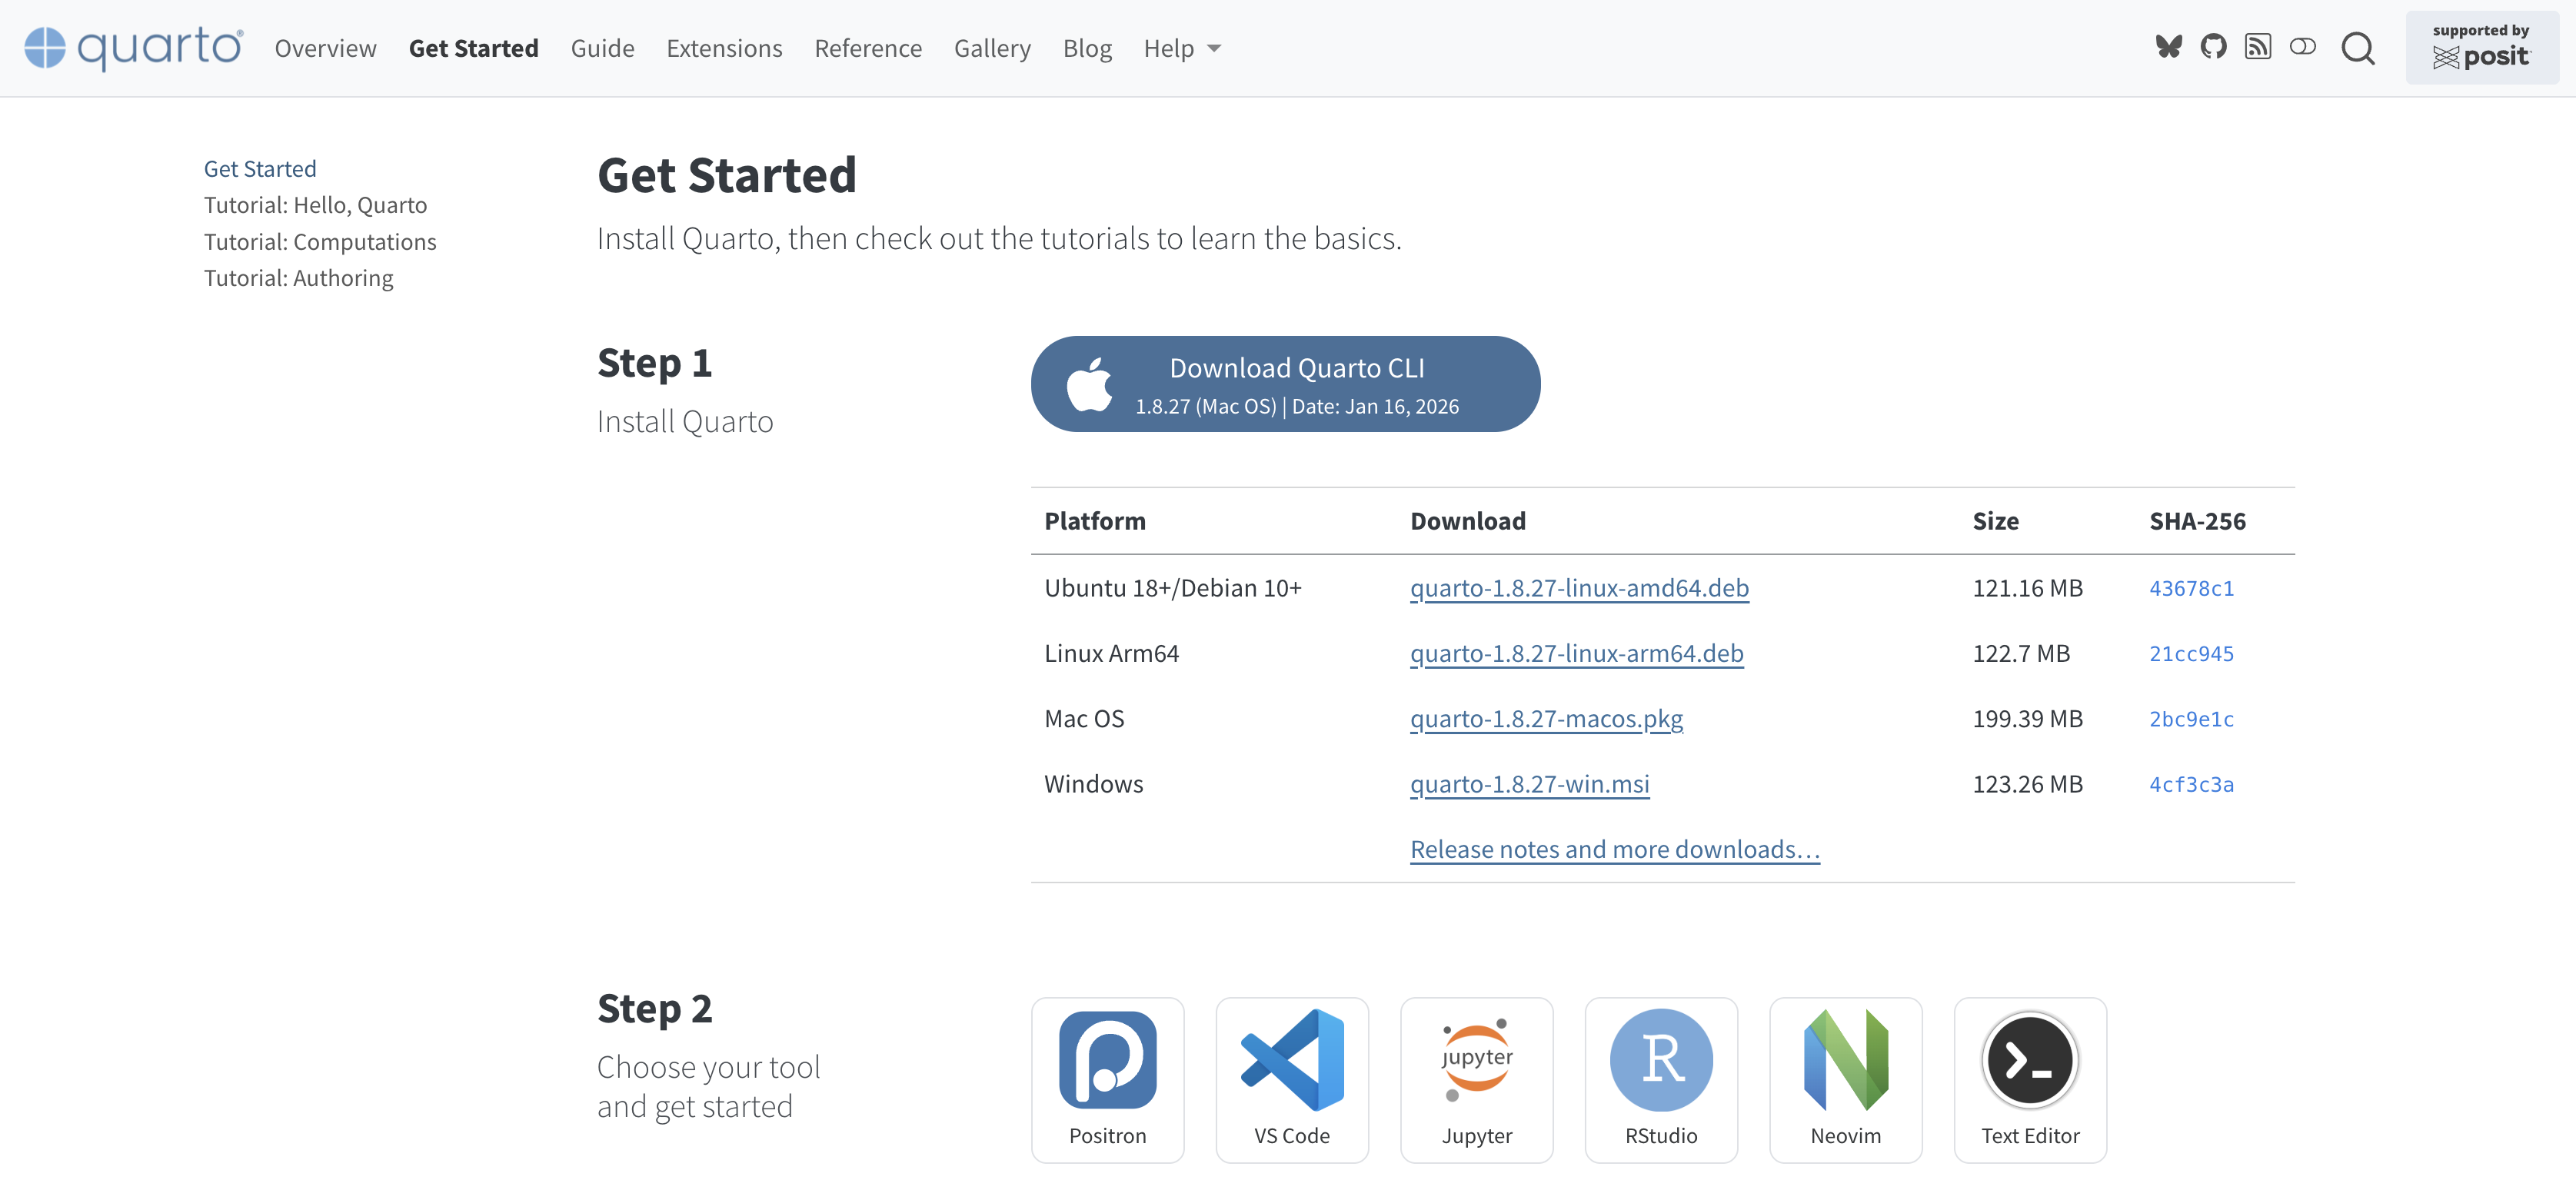
Installation
- Ensure R and RStudio are installed
- Check if Quarto is already available — RStudio v2022.07+ includes Quarto by default:
- If not found, download and install from quarto.org/docs/get-started/
Anatomy of a Quarto document
.qmd file format with three components:
YAML: Metadata
Text: Markdown
Code: R, Python, Observable, and Julia
Weave it all together, and you have beautiful, powerful, and useful outputs!
Anatomy of a Quarto document
Metadata: YAML
Anatomy of a Quarto document
Metadata: YAML
Quarto document
Text: Markdown
report.qmd
---
title: "Measles Surveillance: Ethiopia 2025"
format: html
---
The 2025 National Integrated Measles Supplementary Immunization Campaign (SIAs)
successfully reached **18.5 million children**. However, as we move through
**February 2026**, surveillance data indicates localized "pockets" of
transmission in conflict-affected and drought-prone woredas.
### Current Epidemiological Status
* **National MCV1 Coverage:** 71% (Target: >90%)
* **Key Drivers:** High concentration of "zero-dose" children in border regions.
* **Outbreak Alerts:** 5 active outbreaks reported in the first six weeks of 2026.- Markdown is a lightweight language for creating formatted text
Writing Content
- Use Markdown syntax for formatting text:
-
Bold:
**text** -
Italic:
*text* - Lists:
- Item 1- Item 2
-
Bold:
Creating a Quarto Document
- Create a new file in RStudio:
File -> New File -> Quarto Document. - Use the following YAML header:
Code
report.qmd
---
title: "Measles Surveillance: Ethiopia 2025"
format: html
---

The 2025 National Integrated Measles Supplementary Immunization Campaign (SIAs)
successfully reached **18.5 million children**. However, as we move through
**February 2026**, surveillance data indicates localized "pockets" of
transmission in conflict-affected and drought-prone woredas.

```{r}
#| message: false
library(tidyverse)
measles |>
  ggplot(aes(x = date, y = measles_total)) +
  geom_line(color = "steelblue", linewidth = 0.9)
```- Code chunks begin and end with three backticks (usually)
- Code chunks are identified with a programming language in between
{} -
Code can include optional chunk options, in YAML style, identified by
#|at the beginning of the line
Code - Example: Monthly reported measles cases data
- Embed R code chunks:
```{r}
#| label: fig-monthly-cases
#| fig-cap: "Monthly reported measles cases in Ethiopia, 2012-2024"

measles <- read_csv("data/measles_ts_data.csv", show_col_types = FALSE)

measles |>
  ggplot(aes(x = date, y = measles_total)) +
  geom_line(color = "steelblue", linewidth = 0.9) +
  geom_point(color = "steelblue", size = 0.6) +
  labs(
    title = "Monthly Measles Cases (2012-2024)",
    x = "Date",
    y = "Total cases (monthly)"
  ) +
  scale_x_date(date_breaks = "2 year", date_labels = "%Y") +
  theme_minimal(base_size = 14)
```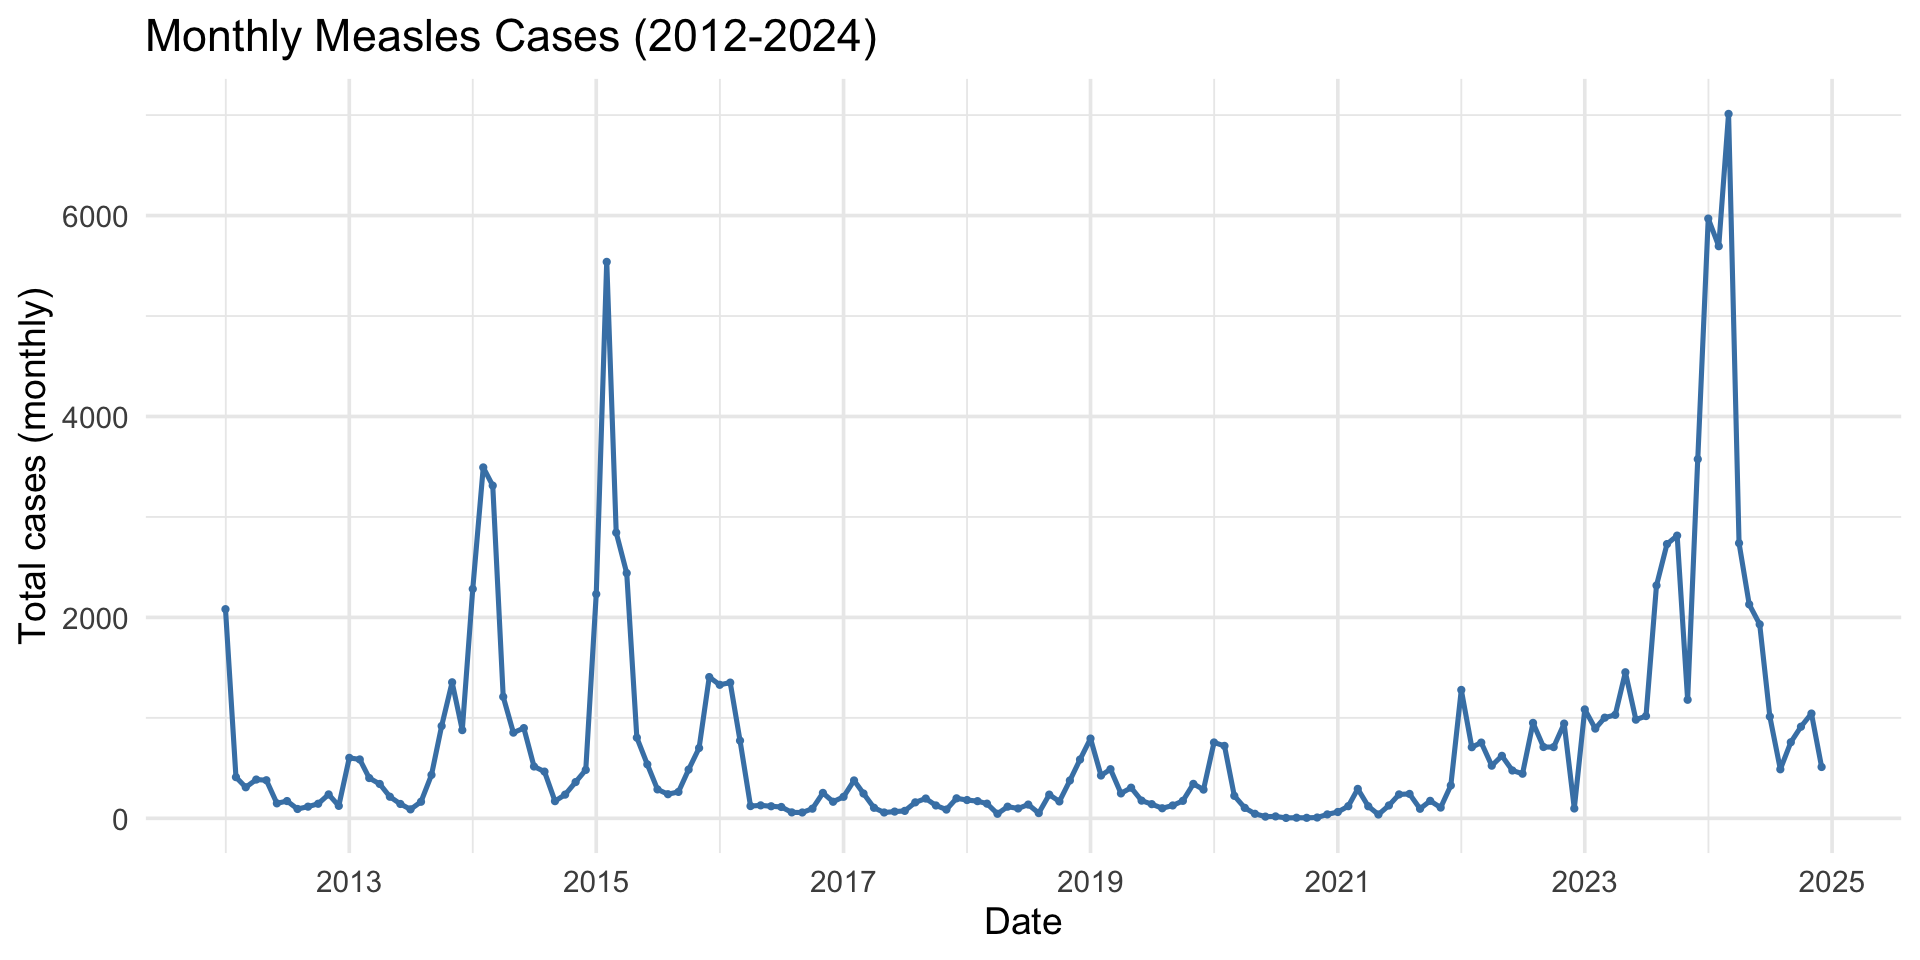
Figure 1: Monthly reported measles cases in Ethiopia, 2012-2024
Common Chunk Options:
-
#| echo: true(Show the code in the output) -
#| echo: false(Hide the code, show only the output) -
#| eval: false(Show the code, but don’t run it) -
#| include: false(Hide code and results)
-
#| label: fig-plot(A unique label for the chunk) -
#| fig-cap: "A caption for the figure."(Adds a figure caption)
Rendering and Sharing
- Render your document: Click the Render button in RStudio.
- Share as HTML, PDF, or Word document.
- Use
quarto render yourfile.qmdin the terminal for command line rendering.
Exercise 1: MCV1 Coverage Report
Task: Using measles_demo.csv, create a one-page summary report (.qmd) that:
- Calculates MCV1 vaccination coverage (%) grouped by region
- Displays the results in a summary table
- Produces a horizontal bar chart of coverage by region
- Renders to HTML and Word (.docx) formats
Exercise 2: YRBSS summary report
Task: Using yrbss.csv, create a one-page summary report (.qmd) that:
- Selects variables:
sex,grade,race4, andbmi - Produces a publication-ready descriptive statistics table stratified by sex using gtsummary
- Adds an Overall column and p-values
- Renders to docx
Note
Hint: Use tbl_summary(by = sex) → add_p() → add_overall() → bold_labels() → italicize_levels().