Quarto dashboards
NDMC, EPHI
February 17 - 20, 2026
![]()

Start from Scratch
Add a card:
Start from scratch
Continue adding cards:
Start from Scratch
Add a title to your cards:
dashboard.qmd
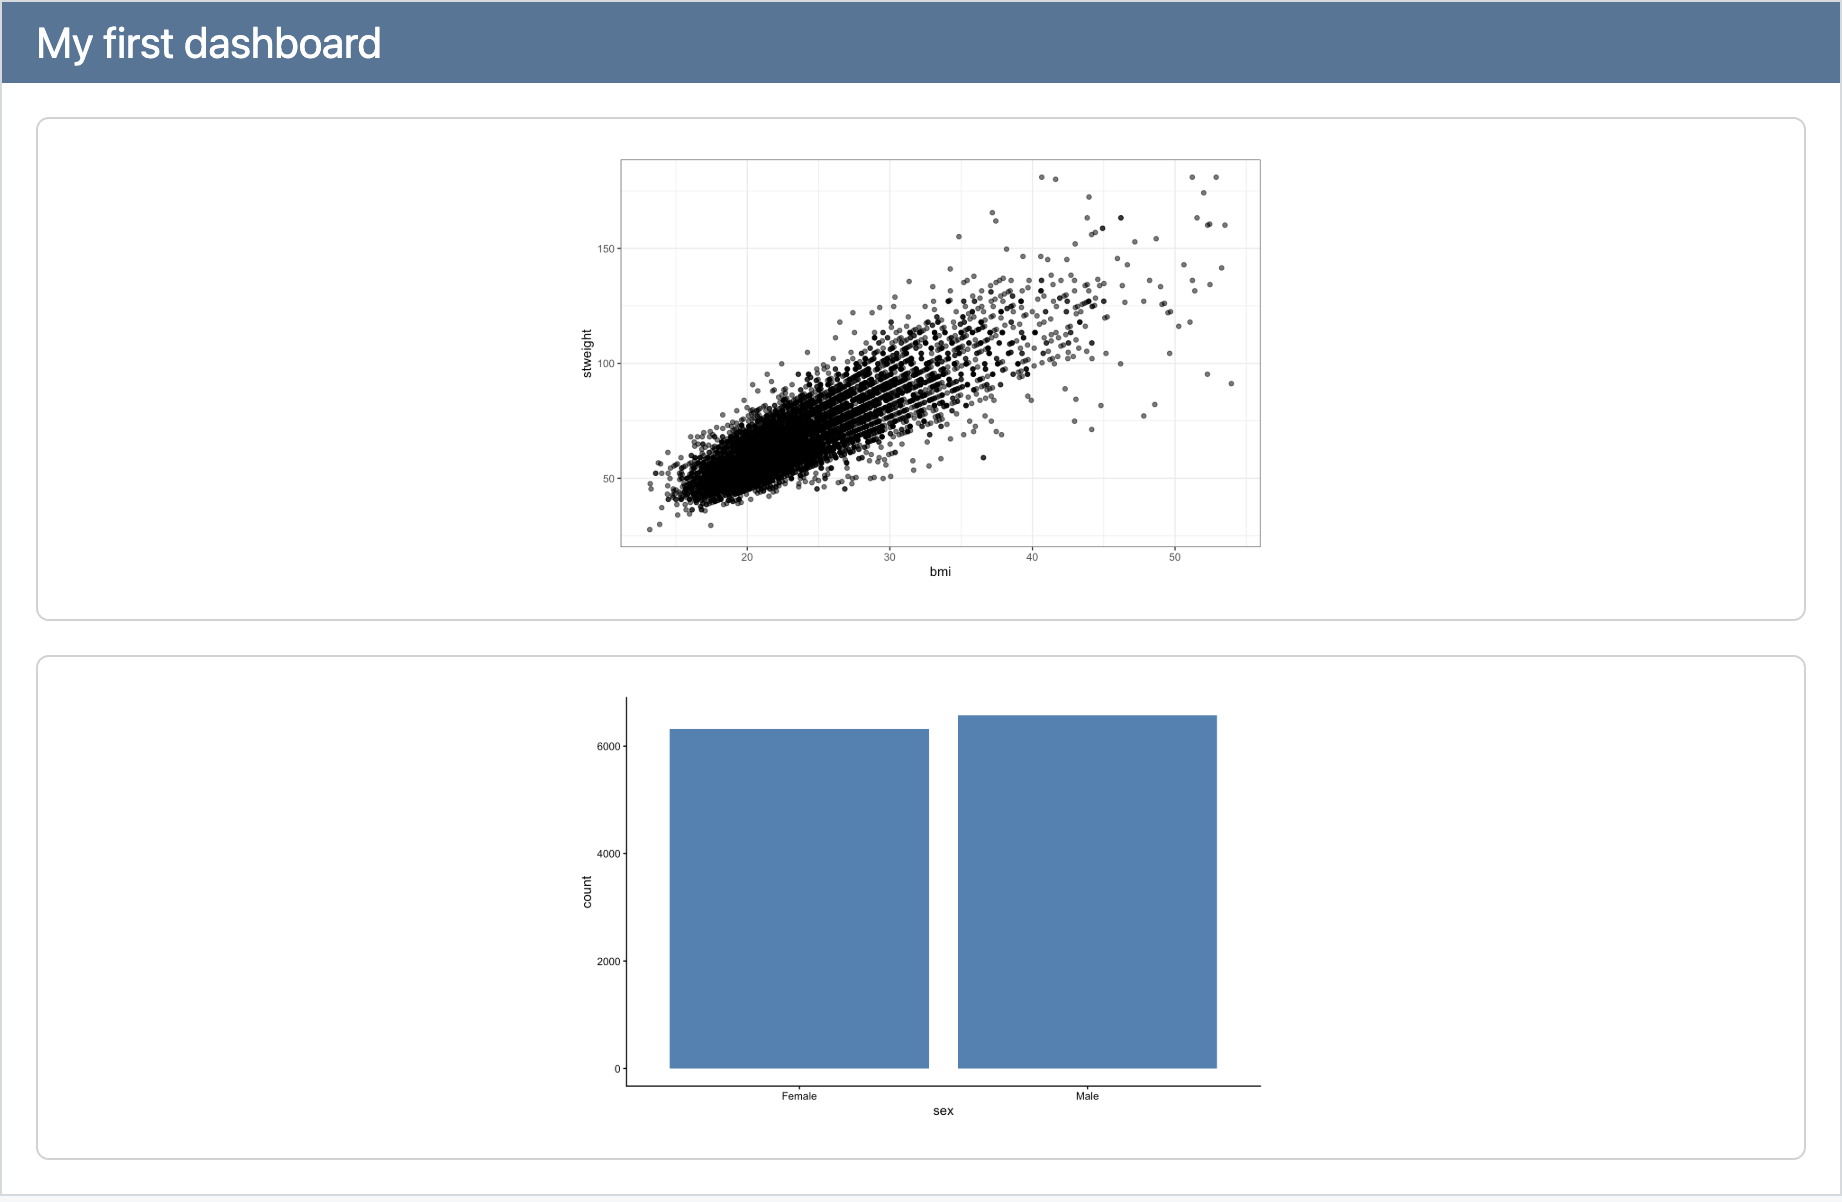
Rows
By default, cards are laid out in rows:
dashboard.qmd
Rows
By default, cards are laid out in rows:
dashboard.qmd
---
title: "My first Quarto dashboard"
format:
dashboard:
orientation: rows
---
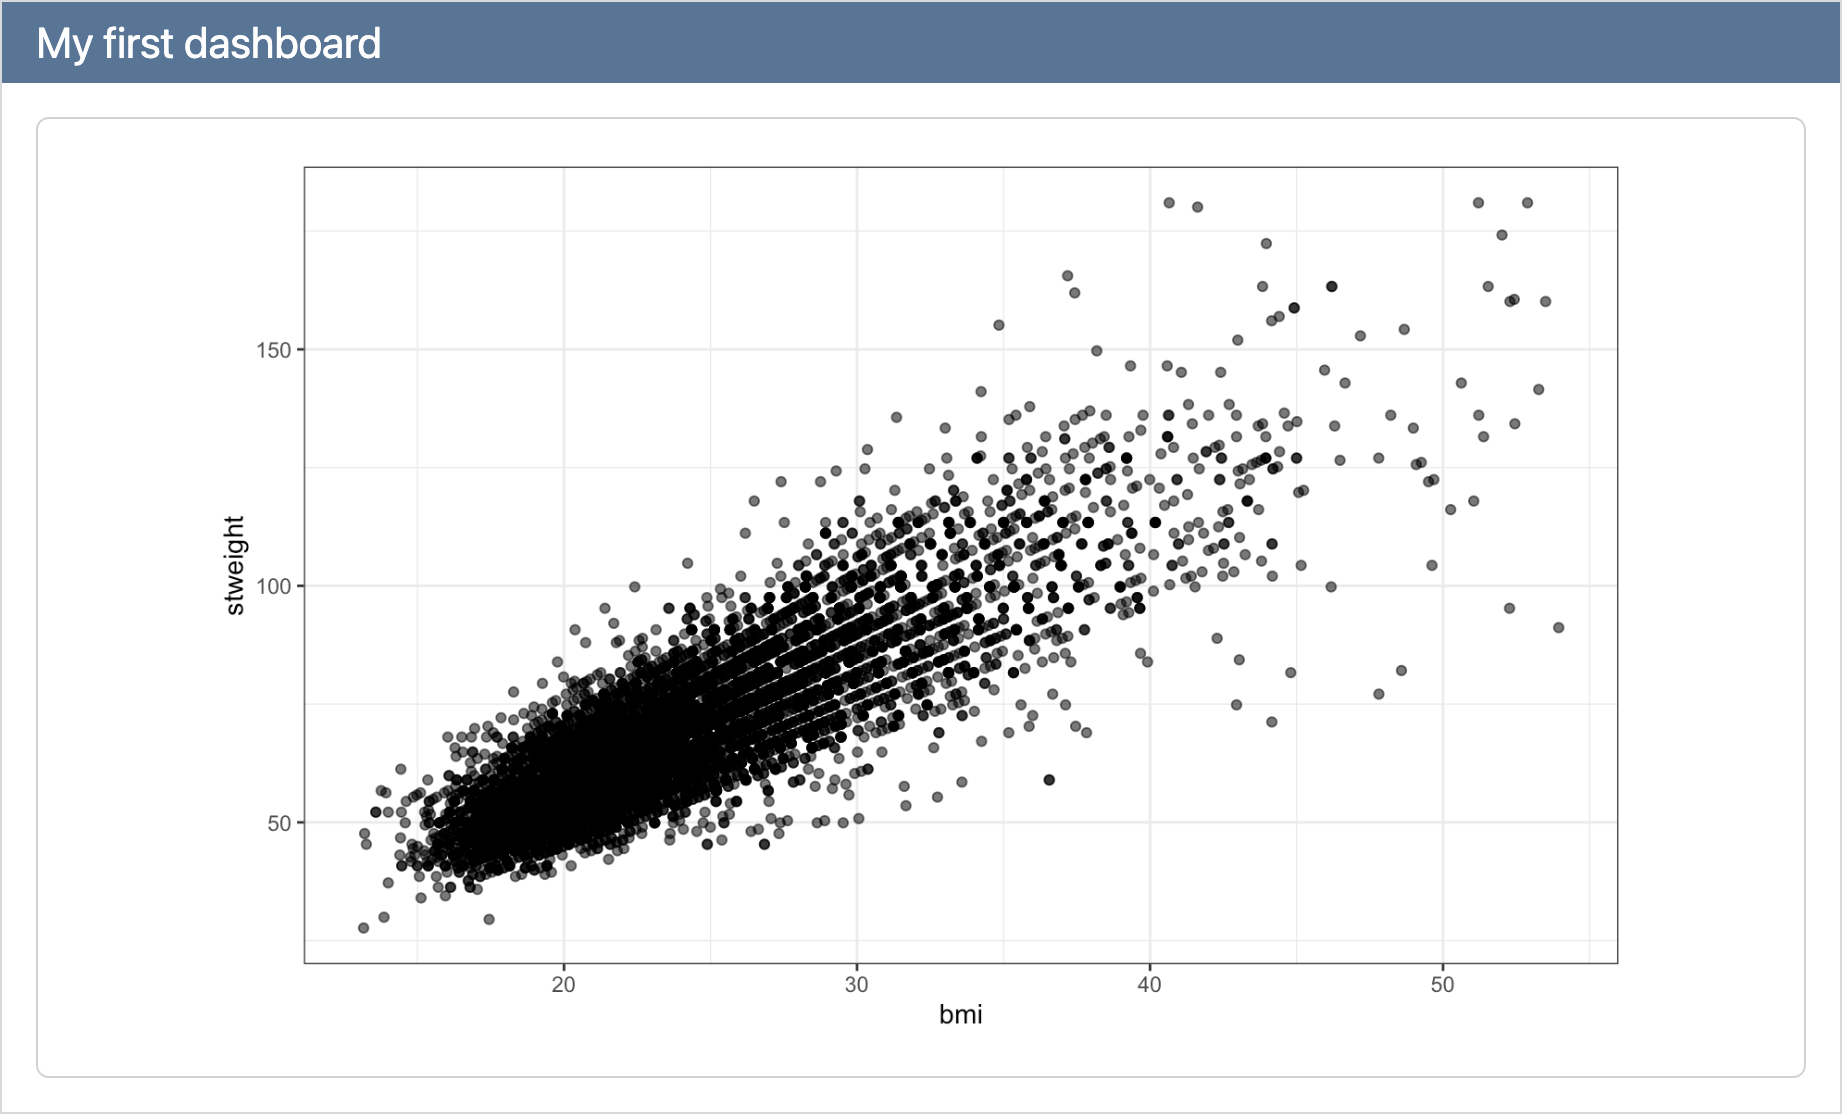
```{r}
#| title: "Plot 1"
ggplot(yrbss_complete, aes(x = bmi, y = stweight)) +
geom_point(alpha = 0.6) +
theme_bw()
```
```{r}
#| title: "Plot 2"
ggplot(yrbss_complete, aes(x = sex)) +
geom_bar(fill = "steelblue") +
theme_classic()
```
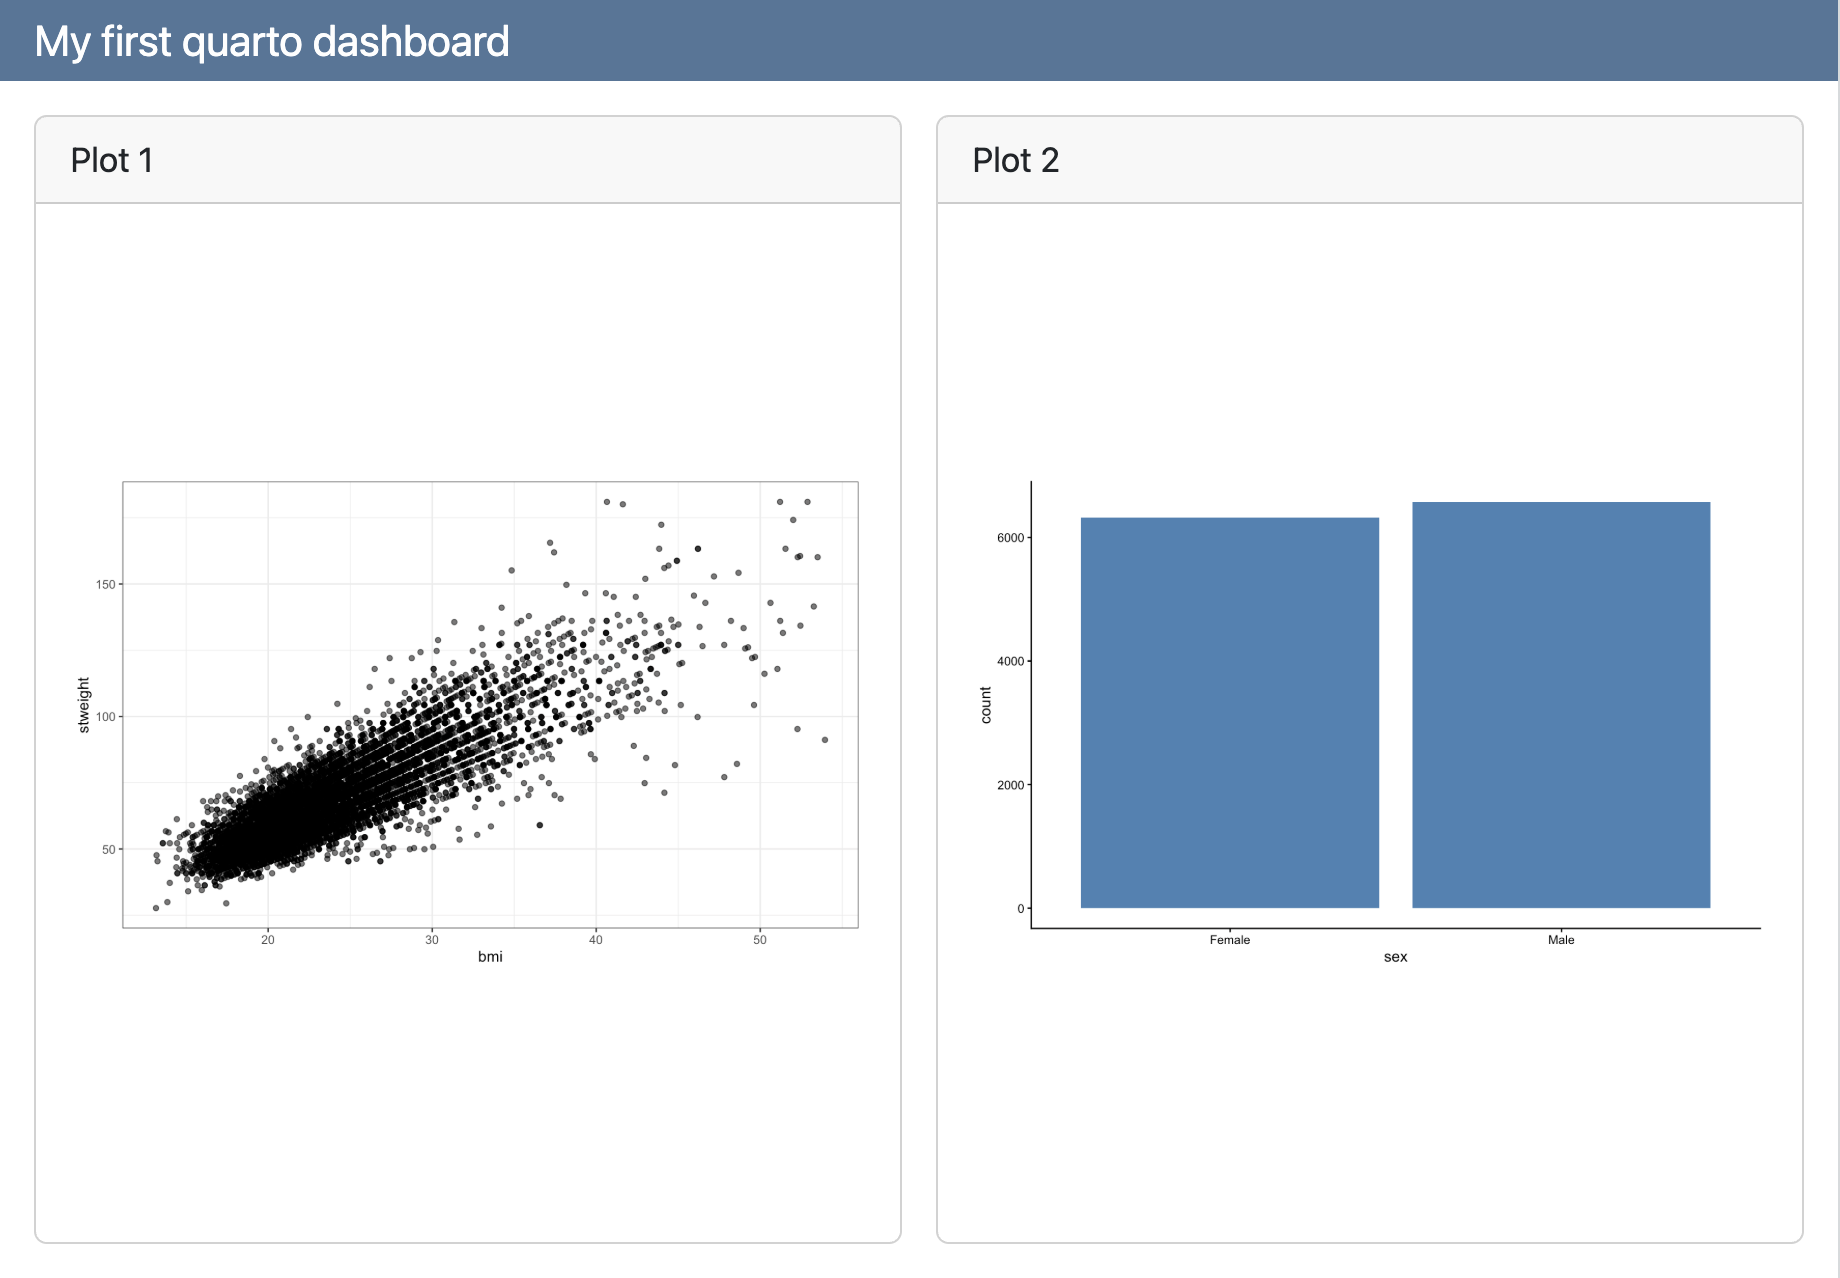
Columns
We can change it to be columns instead:
dashboard.qmd
---
title: "My first Quarto dashboard"
format:
dashboard:
orientation: columns
---
```{r}
#| title: "Plot 1"
ggplot(yrbss_complete, aes(x = bmi, y = stweight)) +
geom_point(alpha = 0.6) +
theme_bw()
```
```{r}
#| title: "Plot 2"
ggplot(yrbss_complete, aes(x = sex)) +
geom_bar(fill = "steelblue") +
theme_classic()
```
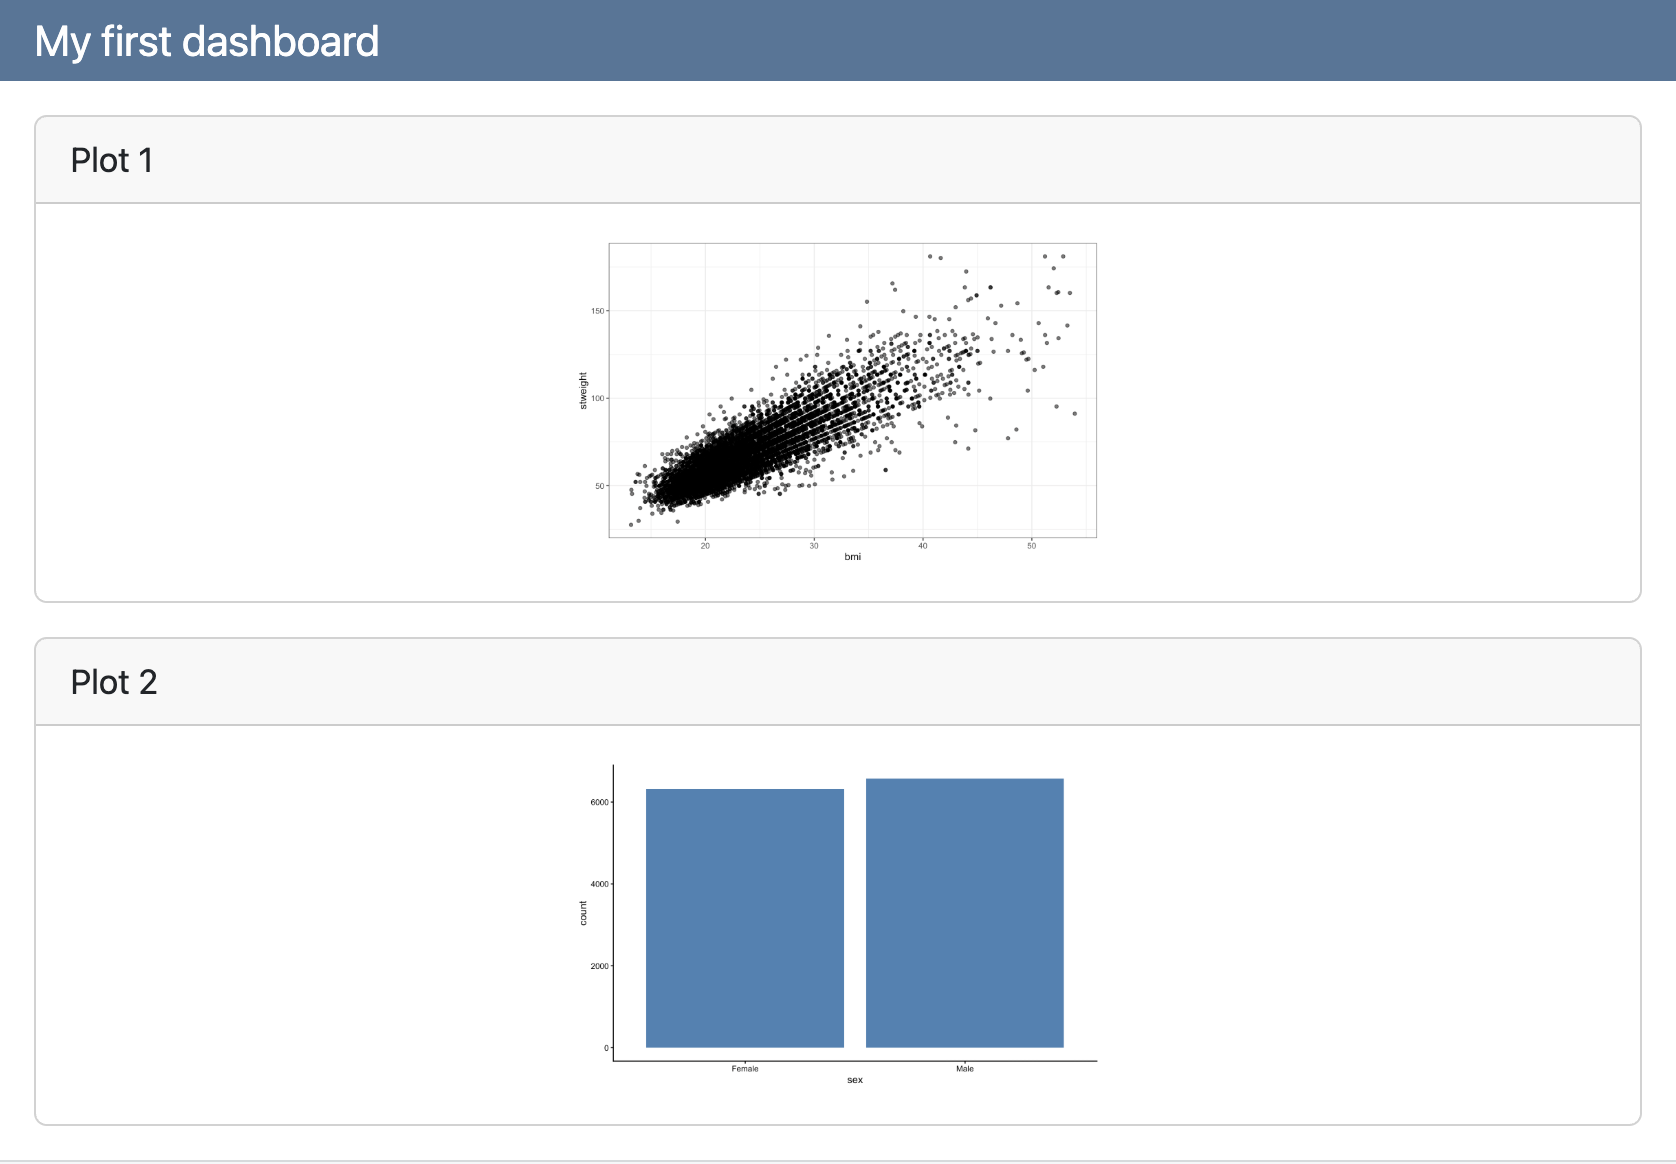
Headings
Alternatively, we can use headings to arrange cards:
dashboard.qmd
---
title: "My first Quarto dashboard"
format:
dashboard:
orientation: rows
---
## Row
```{r}
#| title: "Plot 1"
ggplot(yrbss_complete, aes(x = bmi, y = stweight)) +
geom_point(alpha = 0.6) +
theme_bw()
```
```{r}
#| title: "Plot 2"
ggplot(yrbss_complete, aes(x = sex)) +
geom_bar(fill = "steelblue") +
theme_classic()
```
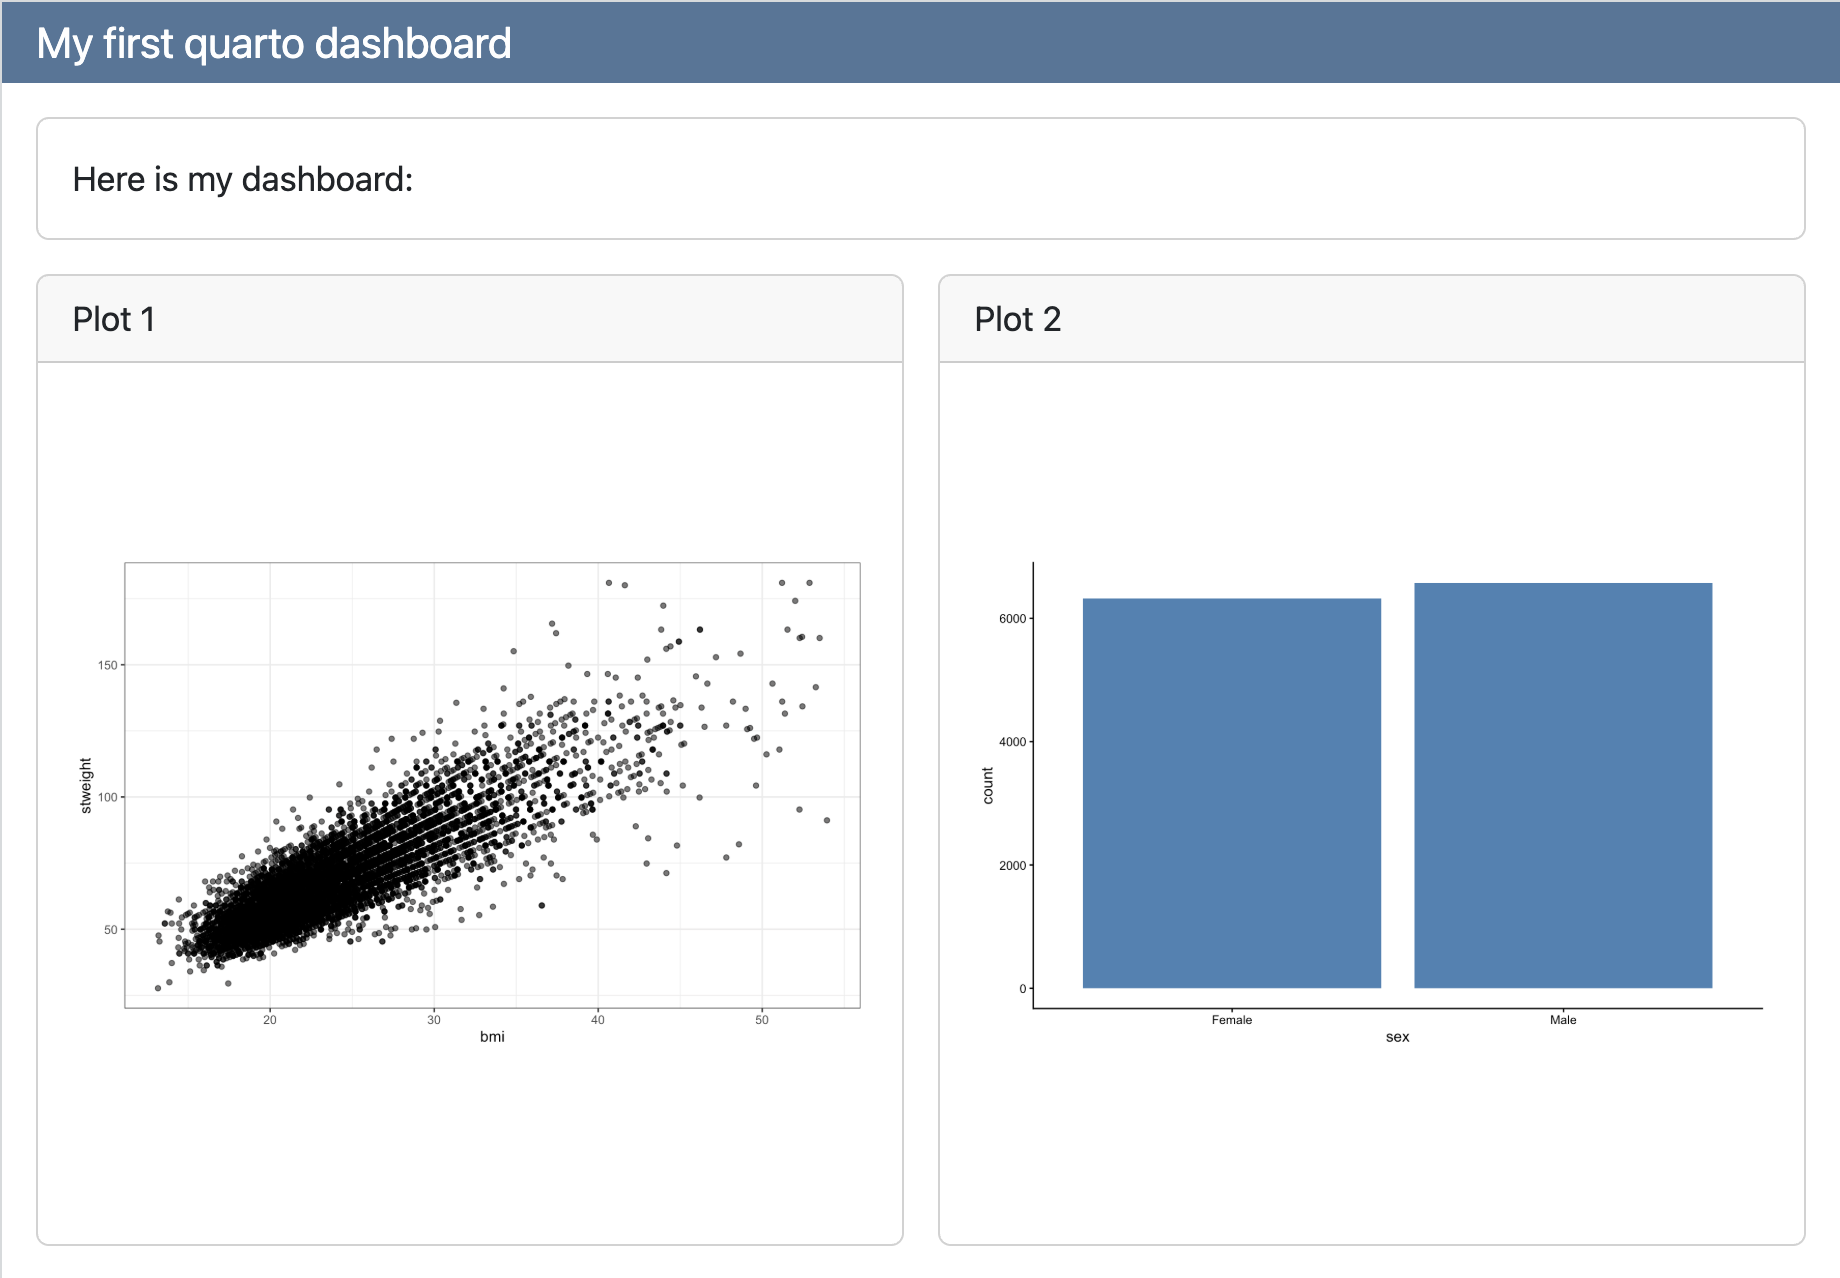
Headings
Make another row with content:
dashboard.qmd
---
title: "My first Quarto dashboard"
format:
dashboard:
orientation: rows
---
## Row
Here is my dashboard:
## Row
```{r}
#| title: "Plot 1"
ggplot(yrbss_complete, aes(x = bmi, y = stweight)) +
geom_point(alpha = 0.6) +
theme_bw()
```
```{r}
#| title: "Plot 2"
ggplot(yrbss_complete, aes(x = sex)) +
geom_bar(fill = "steelblue") +
theme_classic()
```
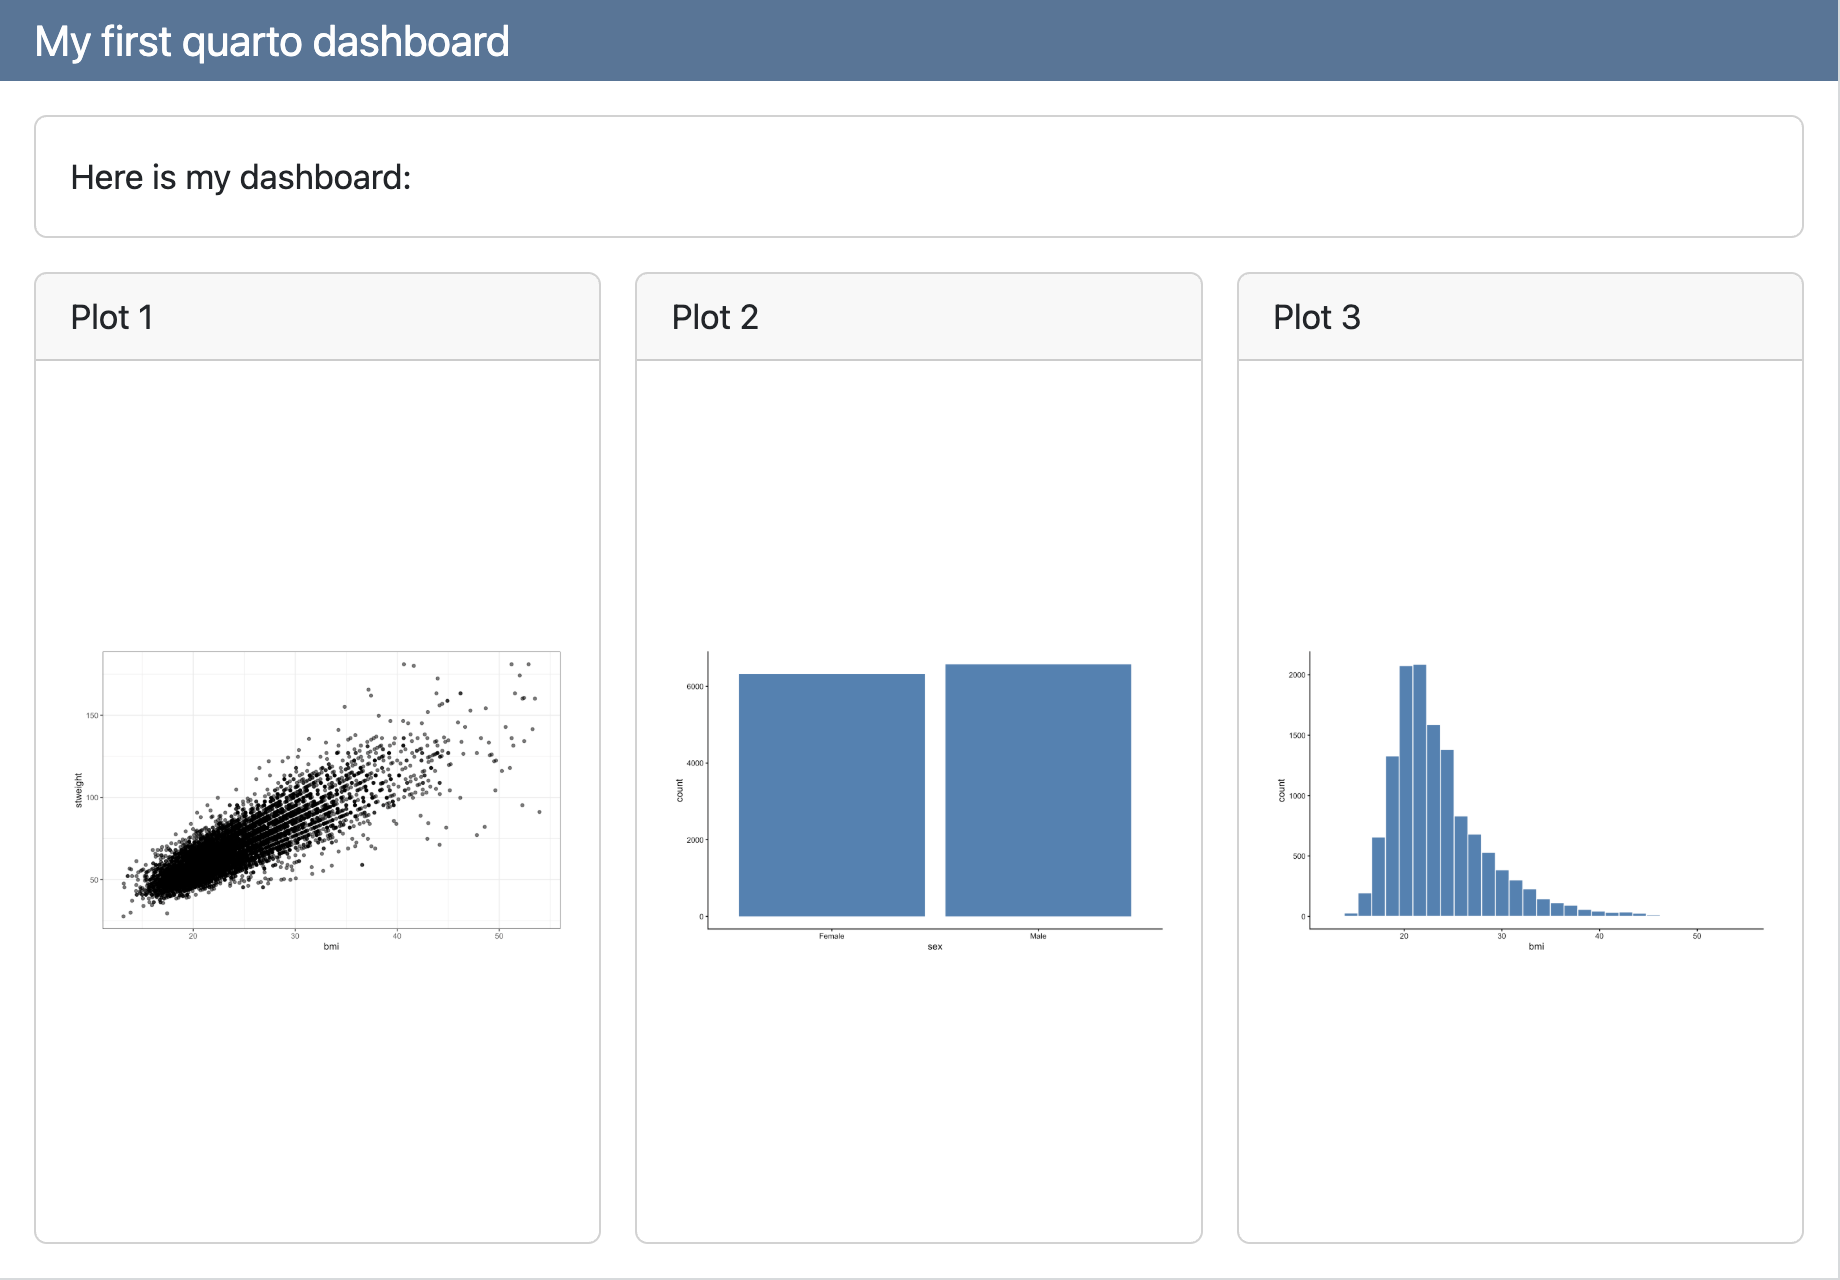
Headings
Continue adding content:
dashboard.qmd
---
title: "My first Quarto dashboard"
format:
dashboard:
orientation: rows
---
## Row
Here is my dashboard:
## Row
```{r}
#| title: "Plot 1"
ggplot(yrbss_complete, aes(x = bmi, y = stweight)) +
geom_point(alpha = 0.6) +
theme_bw()
```
```{r}
#| title: "Plot 2"
ggplot(yrbss_complete, aes(x = sex)) +
geom_bar(fill = "steelblue") +
theme_classic()
```
```{r}
#| title: "Plot 3"
ggplot(yrbss_complete, aes(x = bmi)) +
geom_histogram(fill = "steelblue", color = "white") +
theme_classic()
```
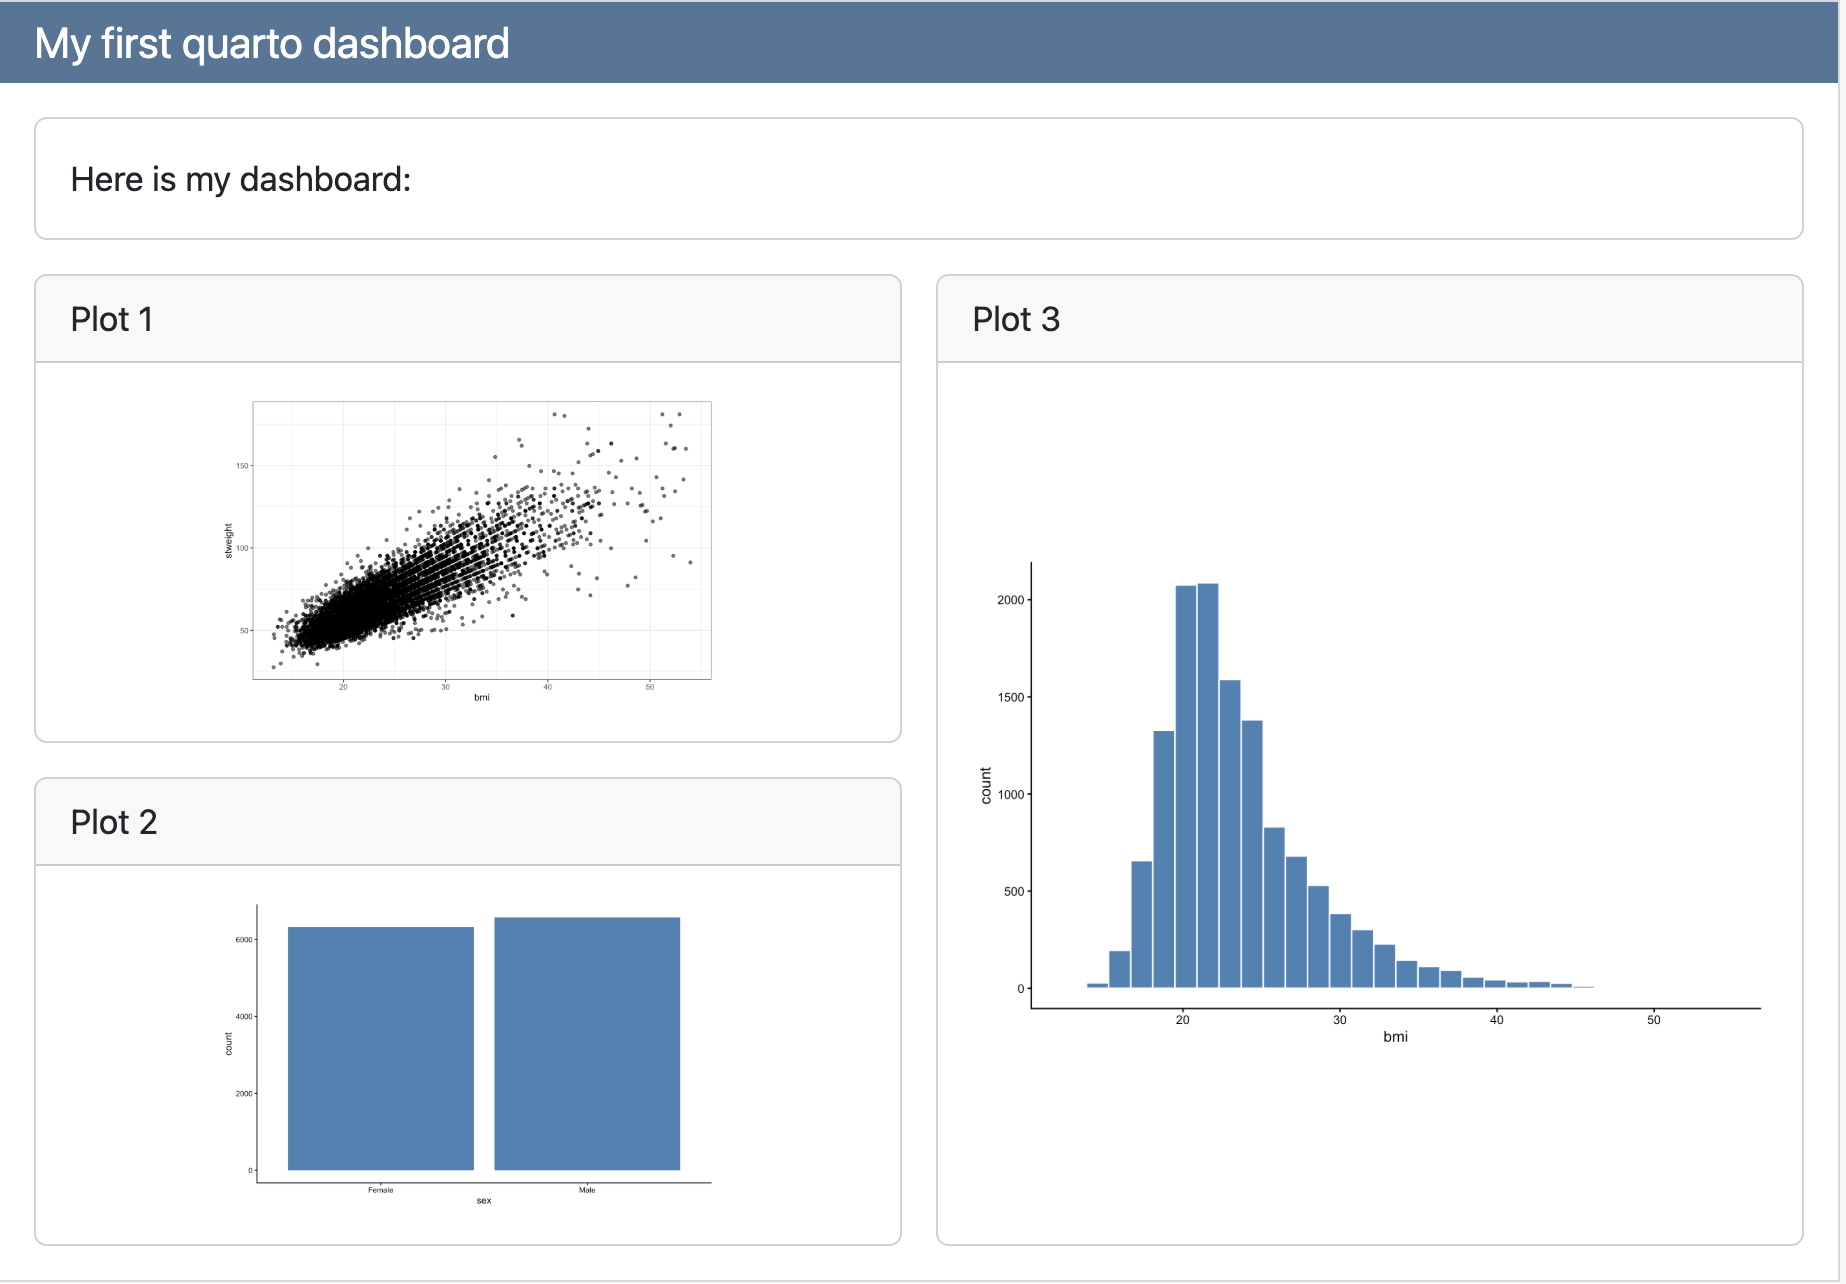
Headings
We can add columns within our rows:
dashboard.qmd
---
title: "My first Quarto dashboard"
format:
dashboard:
orientation: rows
---
## Row
Here is my dashboard:
## Row
### Column
```{r}
#| title: "Plot 1"
ggplot(yrbss_complete, aes(x = bmi, y = stweight)) +
geom_point(alpha = 0.6) +
theme_bw()
```
```{r}
#| title: "Plot 2"
ggplot(yrbss_complete, aes(x = sex)) +
geom_bar(fill = "steelblue") +
theme_classic()
```
### Column
```{r}
#| title: "Plot 3"
ggplot(yrbss_complete, aes(x = bmi)) +
geom_histogram(fill = "steelblue", color = "white") +
theme_classic()
```
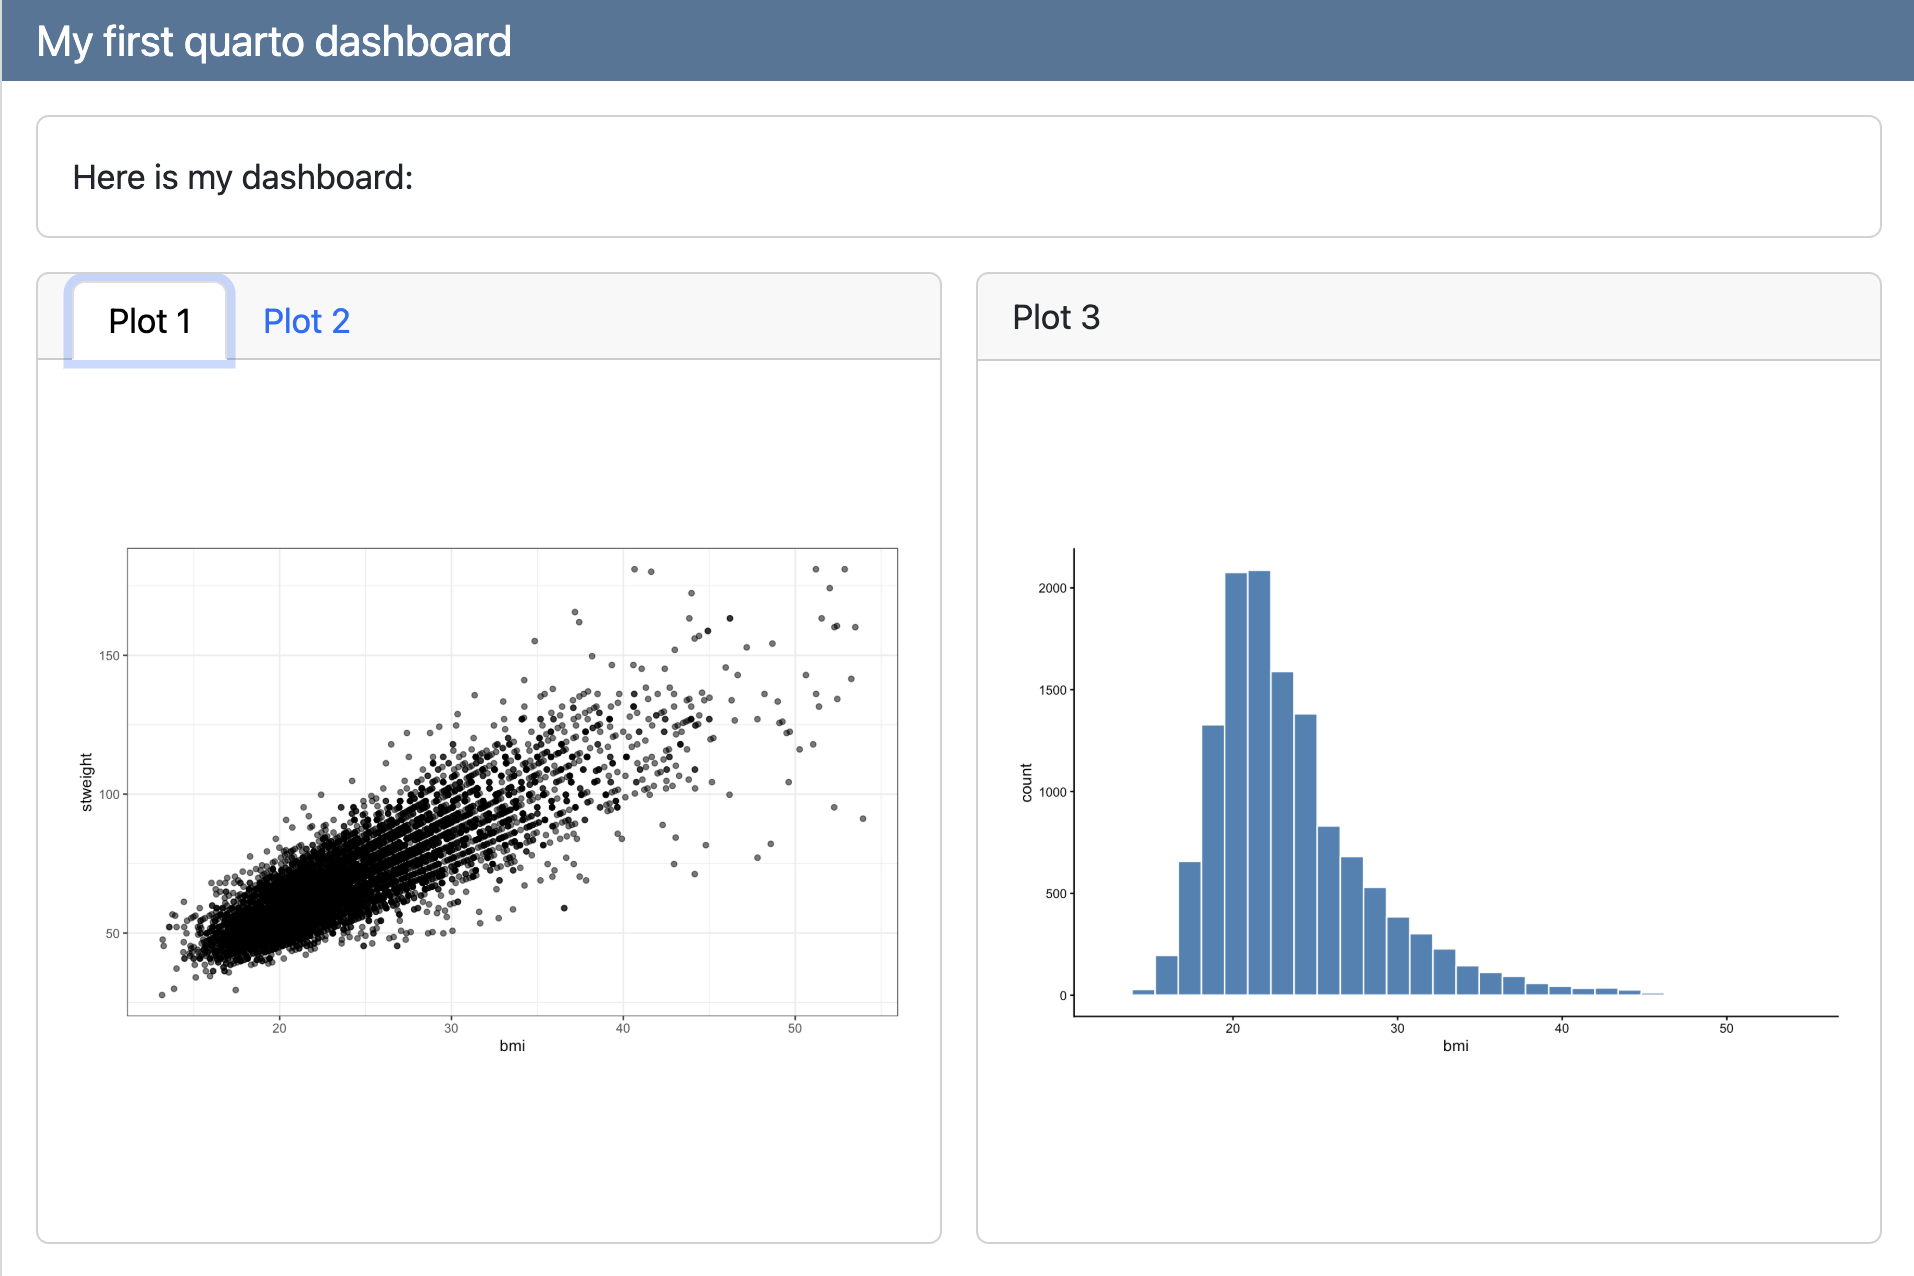
Tabsets
Or use tabsets to put content in different tabs:
dashboard.qmd
---
title: "My first Quarto dashboard"
format:
dashboard:
orientation: rows
---
## Row
Here is my dashboard:
## Row
### Column {.tabset}
```{r}
#| title: "Plot 1"
ggplot(yrbss_complete, aes(x = bmi, y = stweight)) +
geom_point(alpha = 0.6) +
theme_bw()
```
```{r}
#| title: "Plot 2"
ggplot(yrbss_complete, aes(x = sex)) +
geom_bar(fill = "steelblue") +
theme_classic()
```
### Column
```{r}
#| title: "Plot 3"
ggplot(yrbss_complete, aes(x = bmi)) +
geom_histogram(fill = "steelblue", color = "white") +
theme_classic()
```
Tabsets
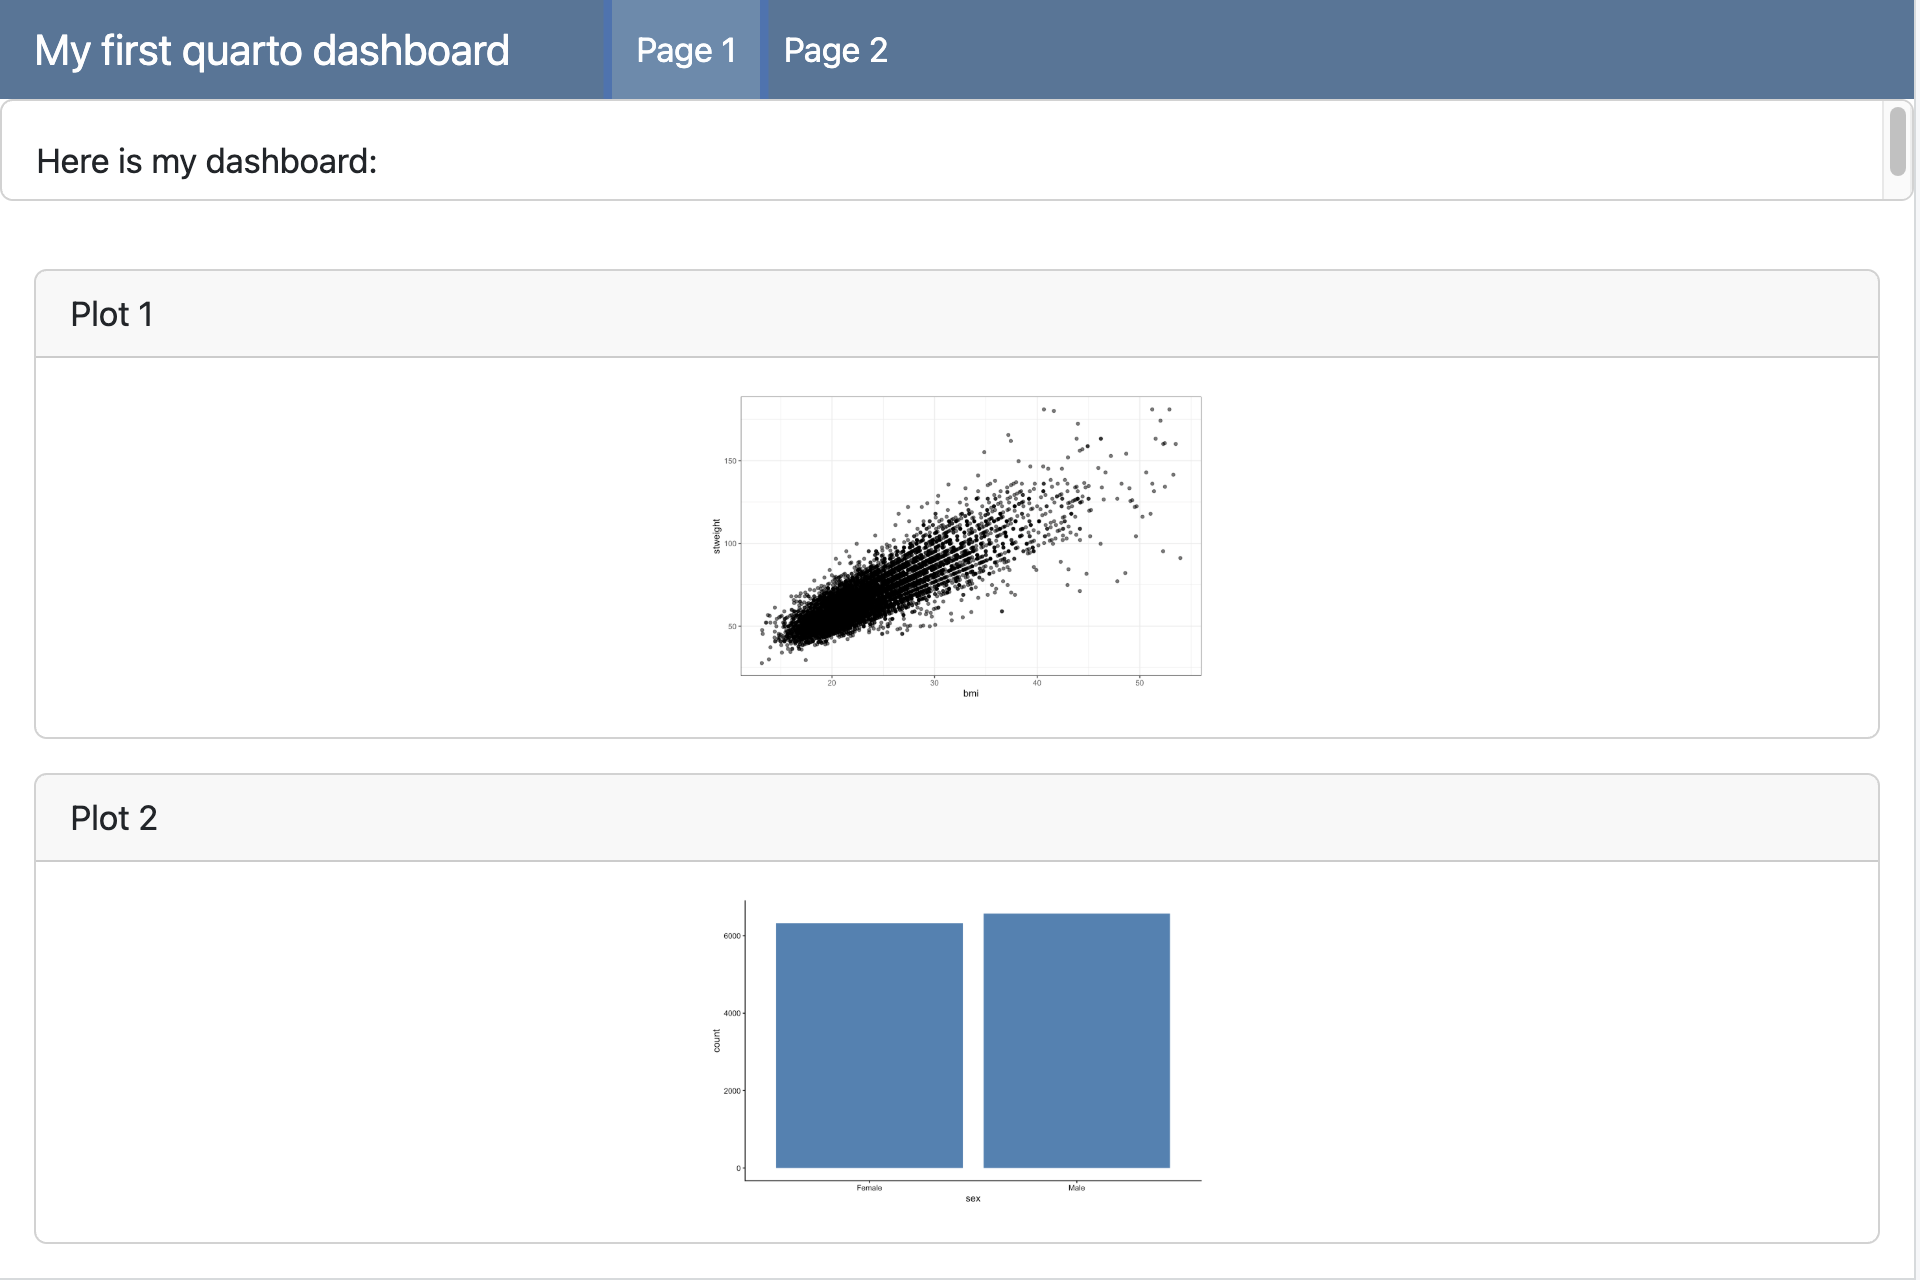
Pages
Use a Level 1 heading to create new pages:
dashboard.qmd
---
title: "My first Quarto dashboard"
format:
dashboard:
orientation: rows
---
## Row
Here is my dashboard:
# Page 1
```{r}
#| title: "Plot 1"
ggplot(yrbss_complete, aes(x = bmi, y = stweight)) +
geom_point(alpha = 0.6) +
theme_bw()
```
```{r}
#| title: "Plot 2"
ggplot(yrbss_complete, aes(x = sex)) +
geom_bar(fill = "steelblue") +
theme_classic()
```
# Page 2
```{r}
#| title: "Plot 3"
ggplot(yrbss_complete, aes(x = bmi)) +
geom_histogram(fill = "steelblue", color = "white") +
theme_classic()
```
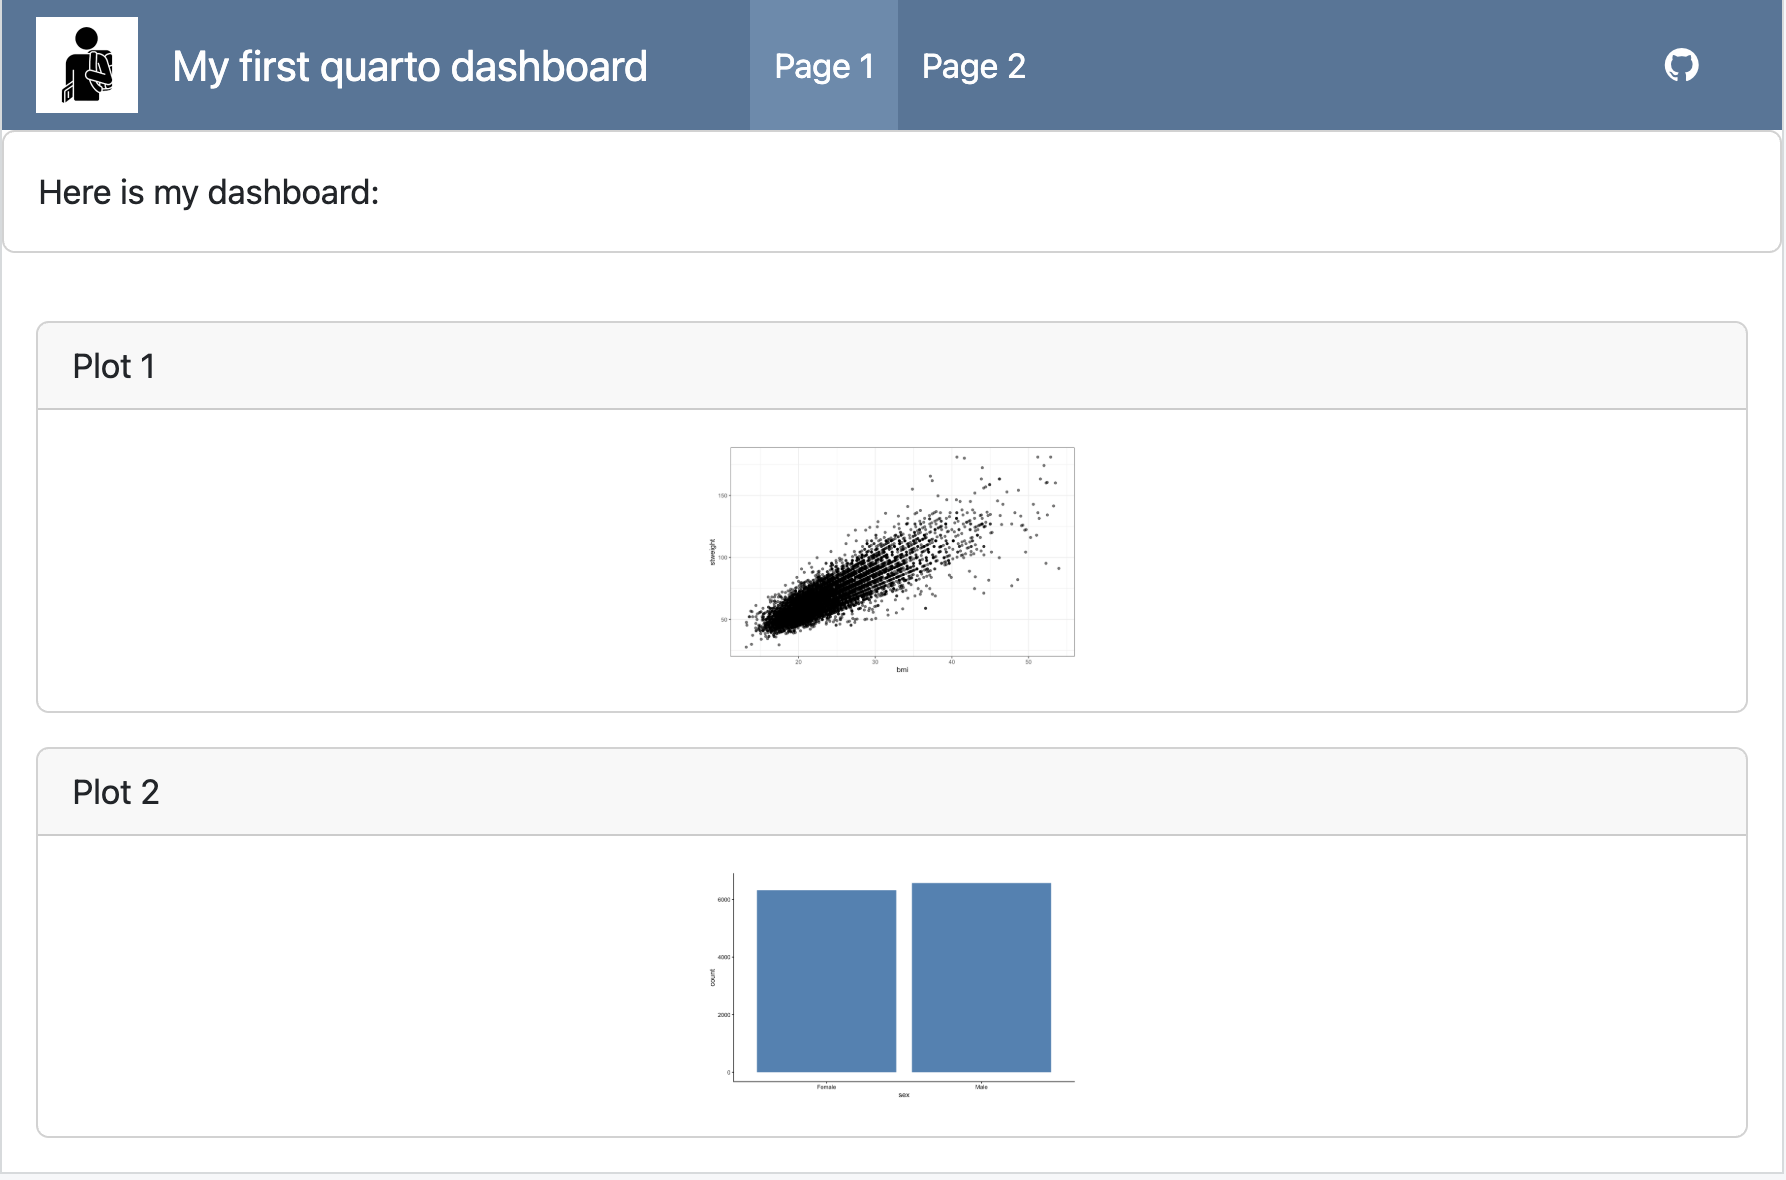
Pages
Use a Level 1 heading to create new pages:
Navigation
Add a logo and buttons to your navigation bar:
dashboard.qmd
---
format:
dashboard:
logo: images/stud.png
nav-buttons:
- icon: github
href: https://github.com/leykunget
---
## Row
Here is my dashboard:
# Page 1
```{r}
#| title: "Plot 1"
ggplot(yrbss_complete, aes(x = bmi, y = stweight)) +
geom_point(alpha = 0.6) +
theme_bw()
```
```{r}
#| title: "Plot 2"
ggplot(yrbss_complete, aes(x = sex)) +
geom_bar(fill = "steelblue") +
theme_classic()
```
# Page 2
```{r}
#| title: "Plot 3"
ggplot(yrbss_complete, aes(x = bmi)) +
geom_histogram(fill = "steelblue", color = "white") +
theme_classic()
```
Navigation
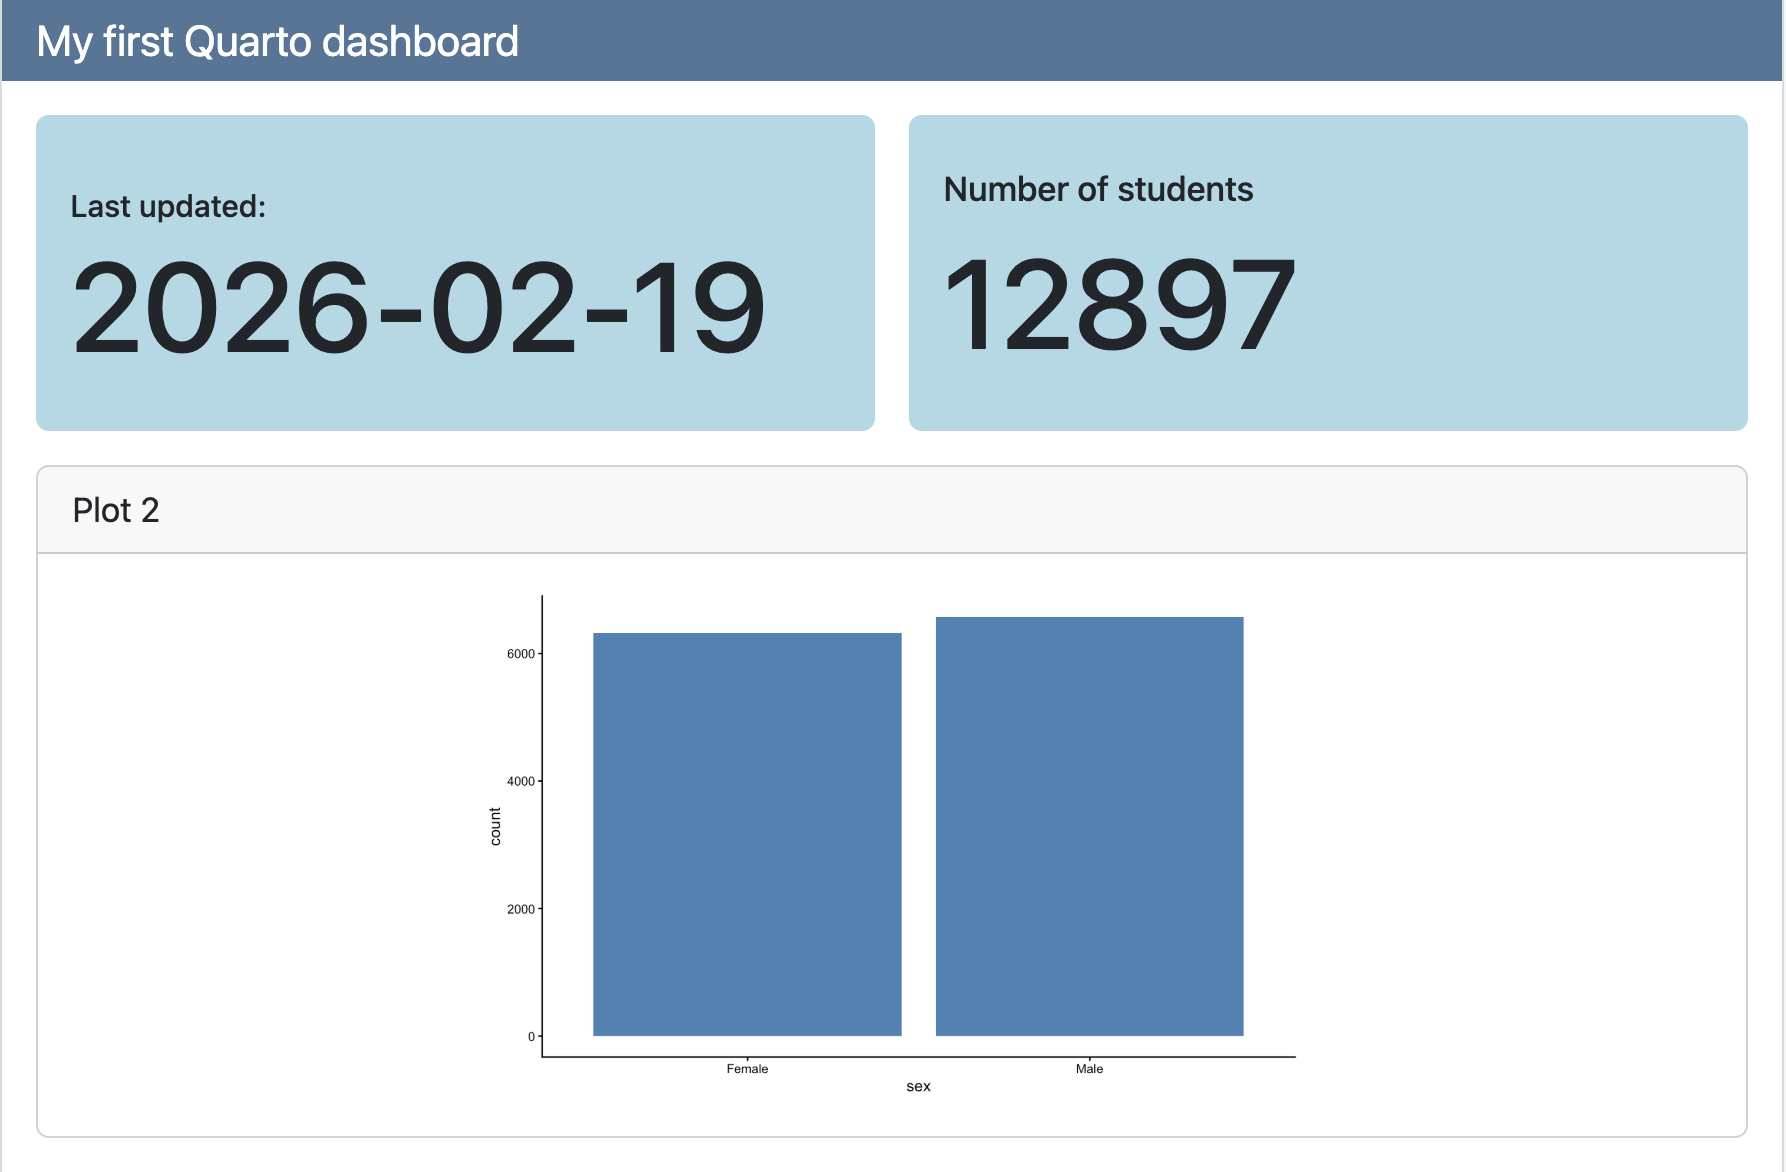
Value Boxes
dashboard.qmd
---
title: "My first Quarto dashboard"
format: dashboard
---
```{r}
#| context: setup
library(tidyverse)
yrbss_complete <- read_csv("data/yrbss_complete.csv")
```
## Row
::: {.valuebox color="#ADD8E6"}
Last updated:
`{{r}} Sys.Date()`
:::
```{r}
#| content: valuebox
#| title: "Number of students"
n <- yrbss_complete |> count() |> pull(n)
list(
color = "#ADD8E6",
value = n
)
```
## Row
```{r}
#| title: "Plot 2"
ggplot(yrbss_complete, aes(x = sex)) +
geom_bar(fill = "steelblue") +
theme_classic()
```
Value Boxes
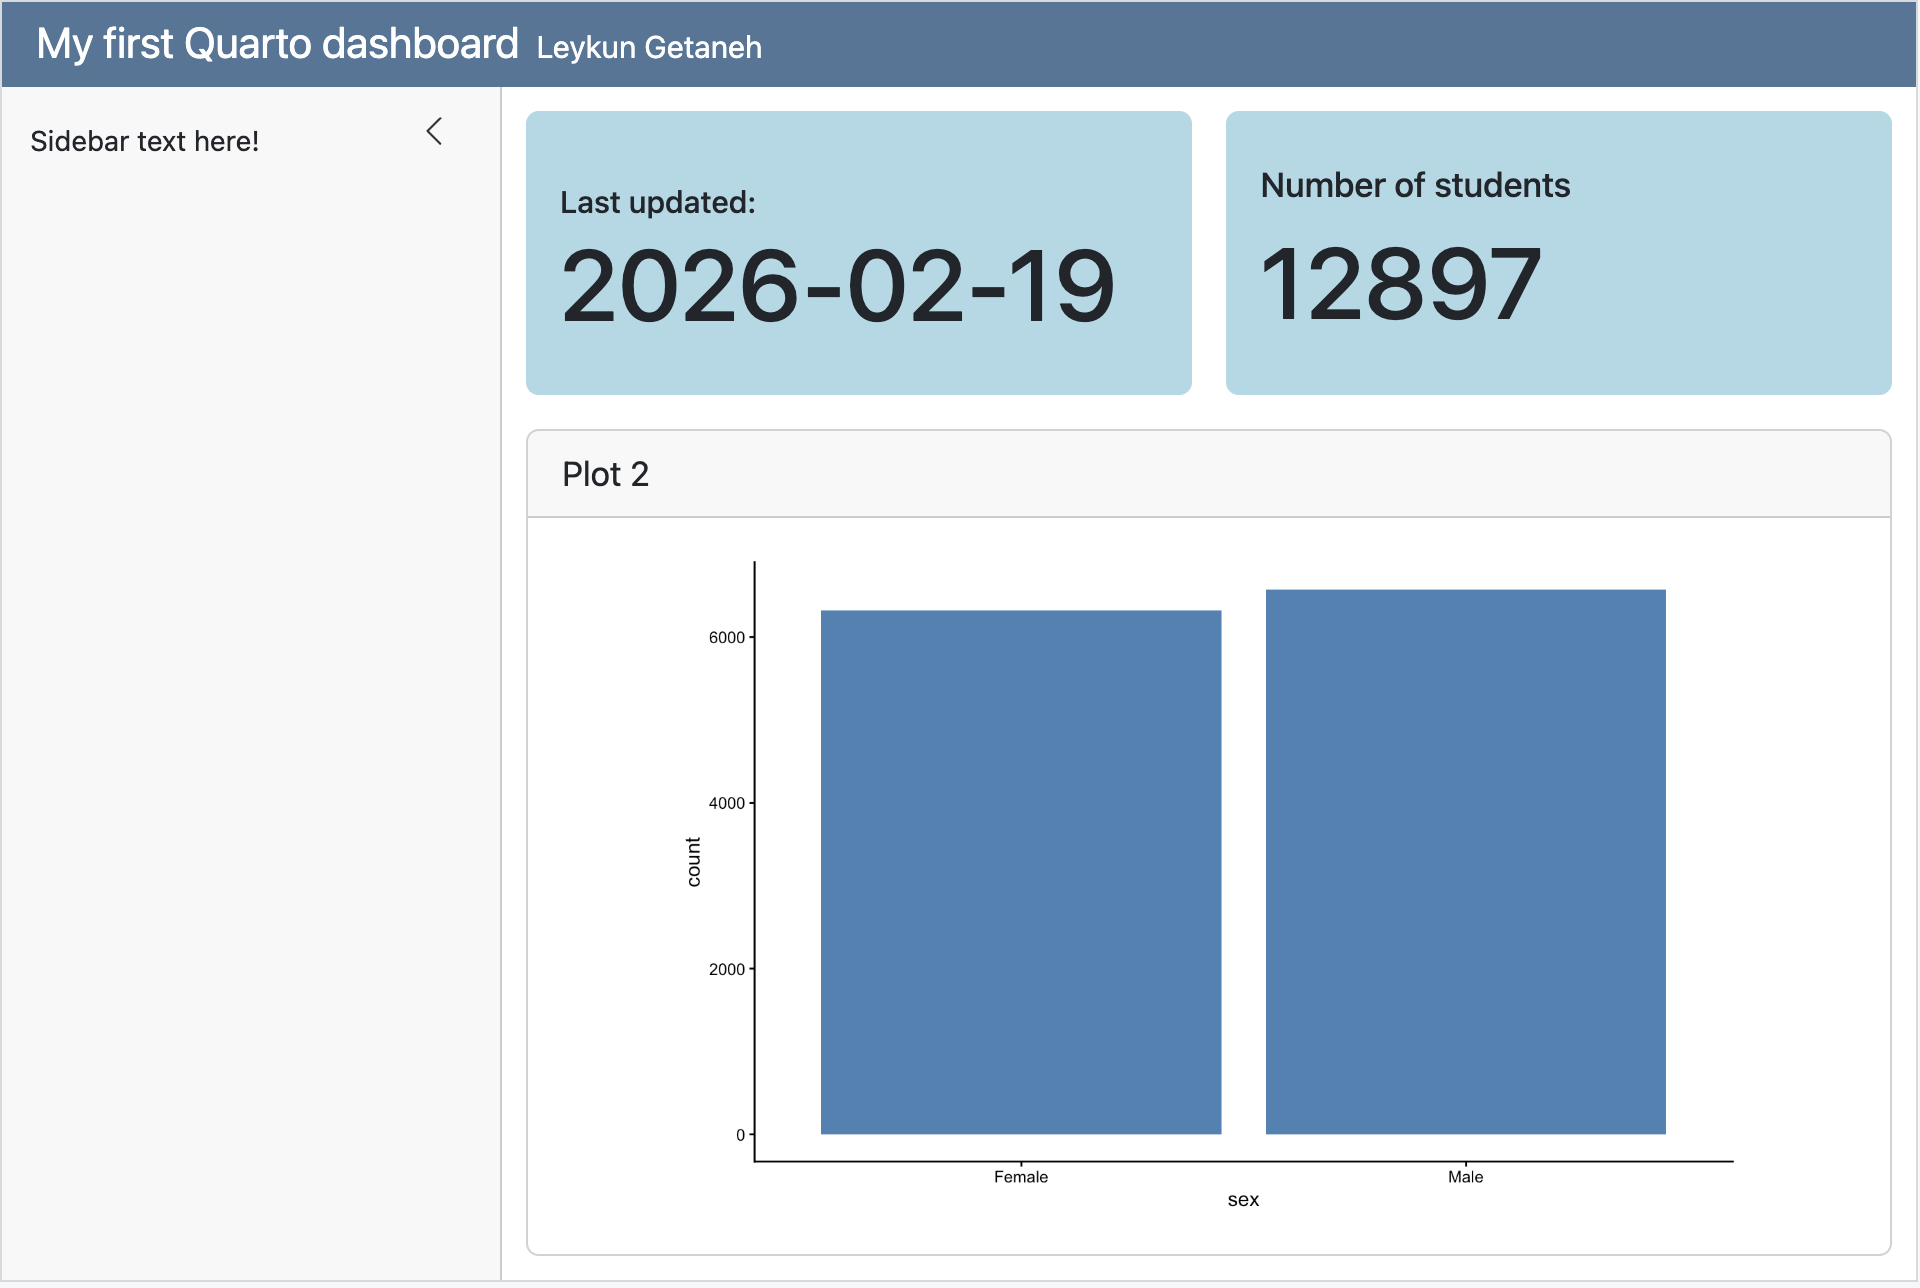
Sidebars
To include a sidebar, add the .sidebar class to a Level 2 heading:
dashboard.qmd
---
title: "My first Quarto dashboard"
format: dashboard
---

## {.sidebar}

Sidebar text here!

## Column

### Row

::: {.valuebox color="#ADD8E6"}
Last updated:

`{{r}} Sys.Date()`
:::

```{r}
#| content: valuebox
#| title: "Number of students"
n <- yrbss_complete |> count() |> pull(n)

list(
  color = "#ADD8E6",
  value = n
)
```

### Row

```{r}
#| title: "Plot 2"
ggplot(yrbss_complete, aes(x = sex)) +
  geom_bar(fill = "steelblue") +
  theme_classic()
```